

64 Ground improvement by deep vibratory methods
with a max representing the peak horizontal acceleration at ground level
resulting from the design earthquake, g the gravity acceleration, σ v0 and ′
σ v0
the total and effective vertical overburden pressure, respectively, and r d the
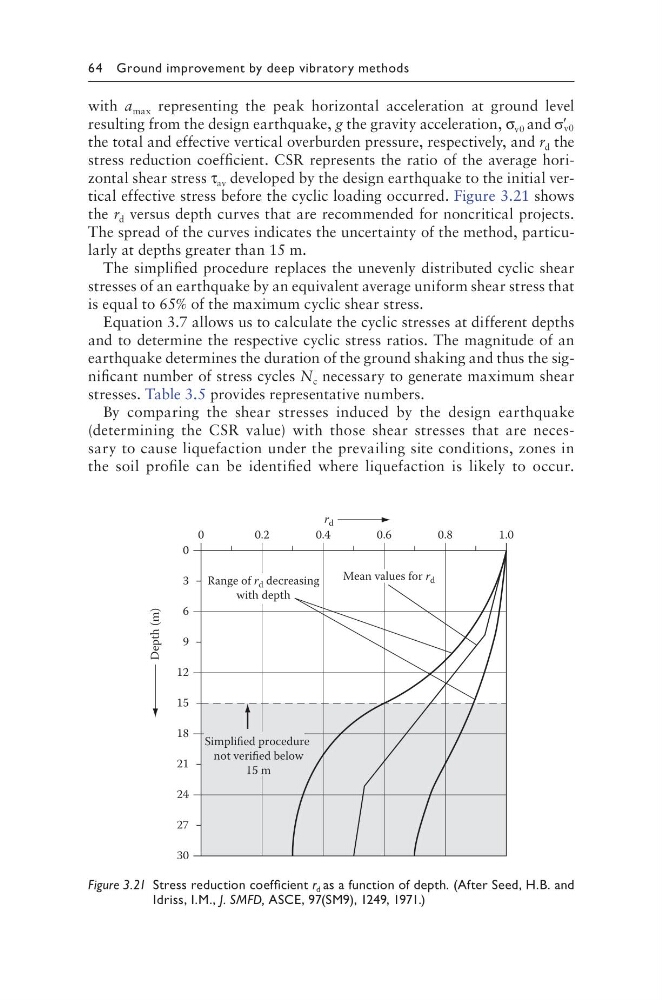
stress reduction coefficient. CSR represents the ratio of the average horizontal shear stress τ av developed by the design earthquake to the initial vertical effective stress before the cyclic loading occurred. Figure 3.21 shows
the r d versus depth curves that are recommended for noncritical projects.
The spread of the curves indicates the uncertainty of the method, particularly at depths greater than 15 m.
The simplified procedure replaces the unevenly distributed cyclic shear
stresses of an earthquake by an equivalent average uniform shear stress that
is equal to 65% of the maximum cyclic shear stress.
Equation 3.7 allows us to calculate the cyclic stresses at different depths
and to determine the respective cyclic stress ratios. The magnitude of an
earthquake determines the duration of the ground shaking and thus the significant number of stress cycles N c necessary to generate maximum shear
stresses. Table 3.5 provides representative numbers.
By comparing the shear stresses induced by the design earthquake
(determining the CSR value) with those shear stresses that are necessary to cause liquefaction under the prevailing site conditions, zones in
the soil profile can be identified where liquefaction is likely to occur.
0
0
3
6
9
12
15
18
21
24
27
30
0.2
0.4
0.6
0.8
1.0
r d
Depth (m)
Range of r d decreasing
with depth
Mean values for r d
Simplified procedure
not verified below
15 m
Figure 3.21 Stress reduction coefficient r d as a function of depth. (After Seed, H.B. and
Idriss, I.M., J. SMFD, ASCE, 97(SM9), 1249, 1971.)
with a max representing the peak horizontal acceleration at ground level
resulting from the design earthquake, g the gravity acceleration, σ v0 and ′
σ v0
the total and effective vertical overburden pressure, respectively, and r d the
stress reduction coefficient. CSR represents the ratio of the average horizontal shear stress τ av developed by the design earthquake to the initial vertical effective stress before the cyclic loading occurred. Figure 3.21 shows
the r d versus depth curves that are recommended for noncritical projects.
The spread of the curves indicates the uncertainty of the method, particularly at depths greater than 15 m.
The simplified procedure replaces the unevenly distributed cyclic shear
stresses of an earthquake by an equivalent average uniform shear stress that
is equal to 65% of the maximum cyclic shear stress.
Equation 3.7 allows us to calculate the cyclic stresses at different depths
and to determine the respective cyclic stress ratios. The magnitude of an
earthquake determines the duration of the ground shaking and thus the significant number of stress cycles N c necessary to generate maximum shear
stresses. Table 3.5 provides representative numbers.
By comparing the shear stresses induced by the design earthquake
(determining the CSR value) with those shear stresses that are necessary to cause liquefaction under the prevailing site conditions, zones in
the soil profile can be identified where liquefaction is likely to occur.
0
0
3
6
9
12
15
18
21
24
27
30
0.2
0.4
0.6
0.8
1.0
r d
Depth (m)
Range of r d decreasing
with depth
Mean values for r d
Simplified procedure
not verified below
15 m
Figure 3.21 Stress reduction coefficient r d as a function of depth. (After Seed, H.B. and
Idriss, I.M., J. SMFD, ASCE, 97(SM9), 1249, 1971.)