

58 Ground improvement by deep vibratory methods
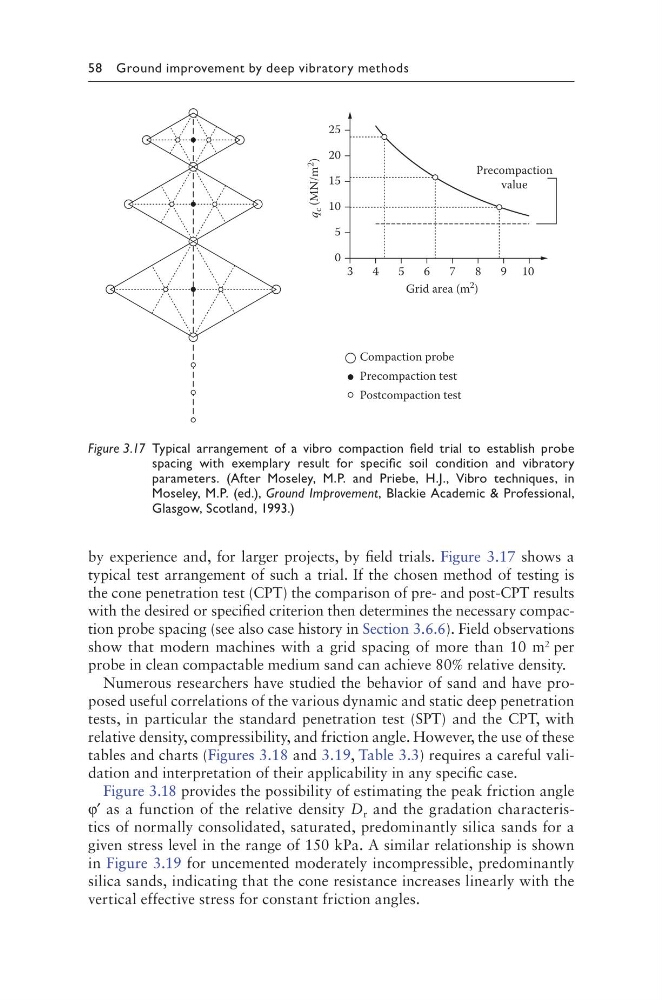
by experience and, for larger projects, by field trials. Figure 3.17 shows a
typical test arrangement of such a trial. If the chosen method of testing is
the cone penetration test (CPT) the comparison of pre- and post-CPT results
with the desired or specified criterion then determines the necessary compaction probe spacing (see also case history in Section 3.6.6). Field observations
show that modern machines with a grid spacing of more than 10 m 2 per
probe in clean compactable medium sand can achieve 80% relative density.
Numerous researchers have studied the behavior of sand and have proposed useful correlations of the various dynamic and static deep penetration
tests, in particular the standard penetration test (SPT) and the CPT, with
relative density, compressibility, and friction angle. However, the use of these
tables and charts (Figures 3.18 and 3.19, Table 3.3) requires a careful validation and interpretation of their applicability in any specific case.
Figure 3.18 provides the possibility of estimating the peak friction angle
φ′ as a function of the relative density D r and the gradation characteristics of normally consolidated, saturated, predominantly silica sands for a
given stress level in the range of 150 kPa. A similar relationship is shown
in Figure 3.19 for uncemented moderately incompressible, predominantly
silica sands, indicating that the cone resistance increases linearly with the
vertical effective stress for constant friction angles.
3
0
5
10
15
20
25
4
5
6
7
8
9 10
Grid area (m
2
)
Precompaction
value
Precompaction test
Postcompaction test
Compaction probe
q
c (MN/m
2
)
Figure 3.17 Typical arrangement of a vibro compaction field trial to establish probe
spacing with exemplary result for specific soil condition and vibratory
parameters. (After Moseley, M.P. and Priebe, H.J., Vibro techniques, in
Moseley, M.P. (ed.), Ground Improvement, Blackie Academic & Professional,
Glasgow, Scotland, 1993.)
by experience and, for larger projects, by field trials. Figure 3.17 shows a
typical test arrangement of such a trial. If the chosen method of testing is
the cone penetration test (CPT) the comparison of pre- and post-CPT results
with the desired or specified criterion then determines the necessary compaction probe spacing (see also case history in Section 3.6.6). Field observations
show that modern machines with a grid spacing of more than 10 m 2 per
probe in clean compactable medium sand can achieve 80% relative density.
Numerous researchers have studied the behavior of sand and have proposed useful correlations of the various dynamic and static deep penetration
tests, in particular the standard penetration test (SPT) and the CPT, with
relative density, compressibility, and friction angle. However, the use of these
tables and charts (Figures 3.18 and 3.19, Table 3.3) requires a careful validation and interpretation of their applicability in any specific case.
Figure 3.18 provides the possibility of estimating the peak friction angle
φ′ as a function of the relative density D r and the gradation characteristics of normally consolidated, saturated, predominantly silica sands for a
given stress level in the range of 150 kPa. A similar relationship is shown
in Figure 3.19 for uncemented moderately incompressible, predominantly
silica sands, indicating that the cone resistance increases linearly with the
vertical effective stress for constant friction angles.
3
0
5
10
15
20
25
4
5
6
7
8
9 10
Grid area (m
2
)
Precompaction
value
Precompaction test
Postcompaction test
Compaction probe
q
c (MN/m
2
)
Figure 3.17 Typical arrangement of a vibro compaction field trial to establish probe
spacing with exemplary result for specific soil condition and vibratory
parameters. (After Moseley, M.P. and Priebe, H.J., Vibro techniques, in
Moseley, M.P. (ed.), Ground Improvement, Blackie Academic & Professional,
Glasgow, Scotland, 1993.)