

Improvement of fine-grained and cohesive soils 169
Figure 4.34b for a square footing (B = 8 m) founded on 25 stone columns
with a c = 0.20 in comparison with the infinite grid situation. Stress concentration within the stone columns results in stress relief in the soil as compared with the situation without stone columns (a c = 0). Below the stone
columns—here at a depth of 6.0 m—soil stresses of the improved and
unimproved case are approaching each other again at about 7–8 m depth.
The distribution of stresses between column and soil, which is in the
first place responsible for the soil improvement, depends both on a c and φ c ,
and also on the foundation situation of the stone column itself (founded in
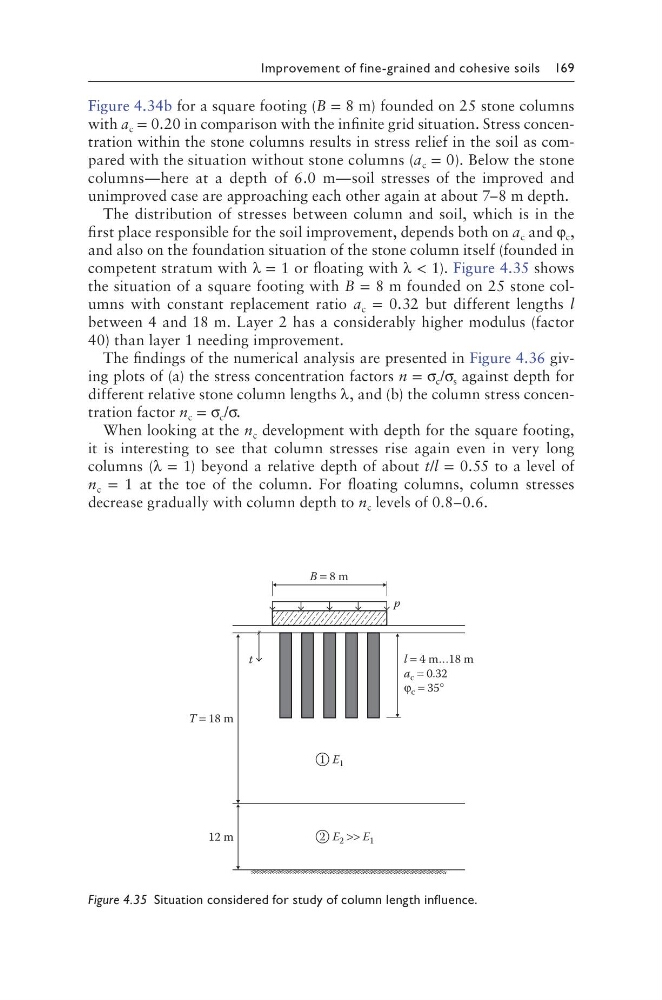
competent stratum with λ = 1 or floating with λ < 1). Figure 4.35 shows
the situation of a square footing with B = 8 m founded on 25 stone columns with constant replacement ratio a c = 0.32 but different lengths l
between 4 and 18 m. Layer 2 has a considerably higher modulus (factor
40) than layer 1 needing improvement.
The findings of the numerical analysis are presented in Figure 4.36 giving plots of (a) the stress concentration factors n = σ c /σ s against depth for
different relative stone column lengths λ, and (b) the column stress concentration factor n c = σ c /σ.
When looking at the n c development with depth for the square footing,
it is interesting to see that column stresses rise again even in very long
columns (λ = 1) beyond a relative depth of about t/l = 0.55 to a level of
n c = 1 at the toe of the column. For floating columns, column stresses
decrease gradually with column depth to n c levels of 0.8–0.6.
B = 8 m
E 1
T = 18 m
12 m
l = 4 m…18 m
a c = 0.32
φ c = 35°
p
t
1
E 2 >> E 1
2
Figure 4.35 Situation considered for study of column length influence.
Figure 4.34b for a square footing (B = 8 m) founded on 25 stone columns
with a c = 0.20 in comparison with the infinite grid situation. Stress concentration within the stone columns results in stress relief in the soil as compared with the situation without stone columns (a c = 0). Below the stone
columns—here at a depth of 6.0 m—soil stresses of the improved and
unimproved case are approaching each other again at about 7–8 m depth.
The distribution of stresses between column and soil, which is in the
first place responsible for the soil improvement, depends both on a c and φ c ,
and also on the foundation situation of the stone column itself (founded in
competent stratum with λ = 1 or floating with λ < 1). Figure 4.35 shows
the situation of a square footing with B = 8 m founded on 25 stone columns with constant replacement ratio a c = 0.32 but different lengths l
between 4 and 18 m. Layer 2 has a considerably higher modulus (factor
40) than layer 1 needing improvement.
The findings of the numerical analysis are presented in Figure 4.36 giving plots of (a) the stress concentration factors n = σ c /σ s against depth for
different relative stone column lengths λ, and (b) the column stress concentration factor n c = σ c /σ.
When looking at the n c development with depth for the square footing,
it is interesting to see that column stresses rise again even in very long
columns (λ = 1) beyond a relative depth of about t/l = 0.55 to a level of
n c = 1 at the toe of the column. For floating columns, column stresses
decrease gradually with column depth to n c levels of 0.8–0.6.
B = 8 m
E 1
T = 18 m
12 m
l = 4 m…18 m
a c = 0.32
φ c = 35°
p
t
1
E 2 >> E 1
2
Figure 4.35 Situation considered for study of column length influence.