

Vibro compaction of granular soils 99
accordingly. This I c correction reduced about 1 in. (25 mm) calculated
liquefaction-induced settlement, compared with these before I c correction.
The posttreatment CPTs were performed two weeks after stone column
installation at the ground surface elevation 4.5 ft (1.4 m) below original
grade. In Figures 3.47 and 3.48, the CPT depths are therefore adjusted to
match the pre- and post-CPT elevations.
Based on the local building code, the site liquefaction analysis should
be based on a 200 years flood water table depth, which is 12.5 ft (3.8 m)
below the ground improvement working elevation. The real groundwater table depth during production was about 32.5 ft (9.9 m). To assist
the bottom feed, S300 vibro probe penetration through the unsaturated
medium stiff to very stiff clay layers present on-site, a Bauer BG-24 drill
rig was used to pre-drill the top 30 ft (9.1 m) with a 2 ft (0.6 m) diameter
auger.
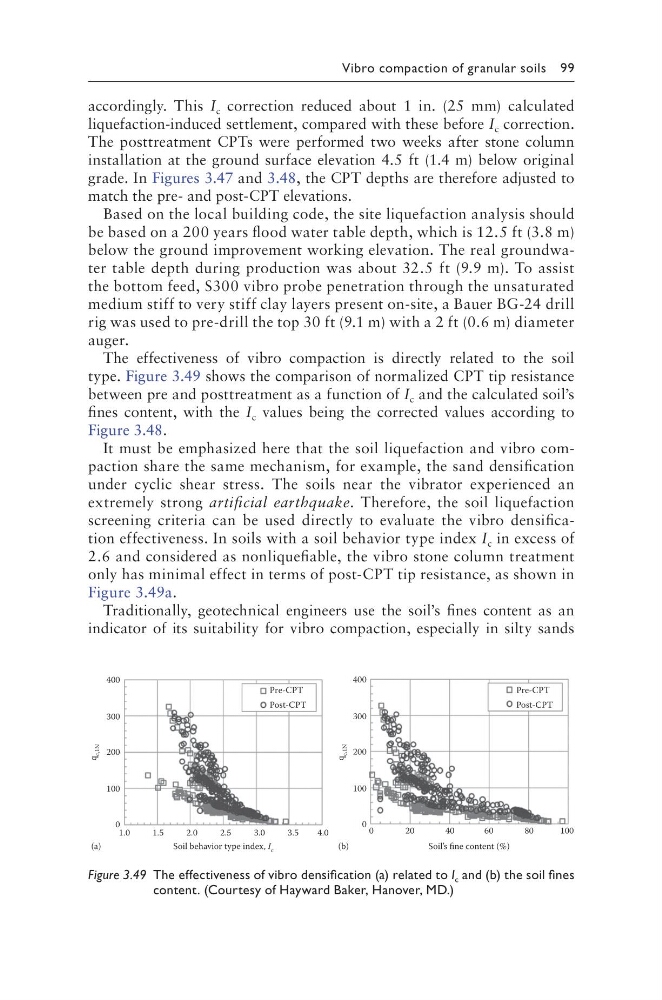
The effectiveness of vibro compaction is directly related to the soil
type. Figure 3.49 shows the comparison of normalized CPT tip resistance
between pre and posttreatment as a function of I c and the calculated soil’s
fines content, with the I c values being the corrected values according to
Figure 3.48.
It must be emphasized here that the soil liquefaction and vibro compaction share the same mechanism, for example, the sand densification
under cyclic shear stress. The soils near the vibrator experienced an
extremely strong artificial earthquake. Therefore, the soil liquefaction
screening criteria can be used directly to evaluate the vibro densification effectiveness. In soils with a soil behavior type index I c in excess of
2.6 and considered as nonliquefiable, the vibro stone column treatment
only has minimal effect in terms of post-CPT tip resistance, as shown in
Figure 3.49a.
Traditionally, geotechnical engineers use the soil’s fines content as an
indicator of its suitability for vibro compaction, especially in silty sands
400
Post-CPT
Pre-CPT
Post-CPT
Pre-CPT
300
200
100
0
400
300
200
100
0
1.0
(a)
(b)
0
q
c,1N
q
c,1N
20
40
60
80
100
1.5
2 .0
2.5
Soil’s fine content (%)
Soil behavior type index, I c
3.0
3 .5
4.0
Figure 3.49 The effectiveness of vibro densification (a) related to I c and (b) the soil fines
content. (Courtesy of Hayward Baker, Hanover, MD.)
accordingly. This I c correction reduced about 1 in. (25 mm) calculated
liquefaction-induced settlement, compared with these before I c correction.
The posttreatment CPTs were performed two weeks after stone column
installation at the ground surface elevation 4.5 ft (1.4 m) below original
grade. In Figures 3.47 and 3.48, the CPT depths are therefore adjusted to
match the pre- and post-CPT elevations.
Based on the local building code, the site liquefaction analysis should
be based on a 200 years flood water table depth, which is 12.5 ft (3.8 m)
below the ground improvement working elevation. The real groundwater table depth during production was about 32.5 ft (9.9 m). To assist
the bottom feed, S300 vibro probe penetration through the unsaturated
medium stiff to very stiff clay layers present on-site, a Bauer BG-24 drill
rig was used to pre-drill the top 30 ft (9.1 m) with a 2 ft (0.6 m) diameter
auger.
The effectiveness of vibro compaction is directly related to the soil
type. Figure 3.49 shows the comparison of normalized CPT tip resistance
between pre and posttreatment as a function of I c and the calculated soil’s
fines content, with the I c values being the corrected values according to
Figure 3.48.
It must be emphasized here that the soil liquefaction and vibro compaction share the same mechanism, for example, the sand densification
under cyclic shear stress. The soils near the vibrator experienced an
extremely strong artificial earthquake. Therefore, the soil liquefaction
screening criteria can be used directly to evaluate the vibro densification effectiveness. In soils with a soil behavior type index I c in excess of
2.6 and considered as nonliquefiable, the vibro stone column treatment
only has minimal effect in terms of post-CPT tip resistance, as shown in
Figure 3.49a.
Traditionally, geotechnical engineers use the soil’s fines content as an
indicator of its suitability for vibro compaction, especially in silty sands
400
Post-CPT
Pre-CPT
Post-CPT
Pre-CPT
300
200
100
0
400
300
200
100
0
1.0
(a)
(b)
0
q
c,1N
q
c,1N
20
40
60
80
100
1.5
2 .0
2.5
Soil’s fine content (%)
Soil behavior type index, I c
3.0
3 .5
4.0
Figure 3.49 The effectiveness of vibro densification (a) related to I c and (b) the soil fines
content. (Courtesy of Hayward Baker, Hanover, MD.)