

Vibro compaction of granular soils 91
surface, the vibrators were switched back to penetration mode at 4 m to
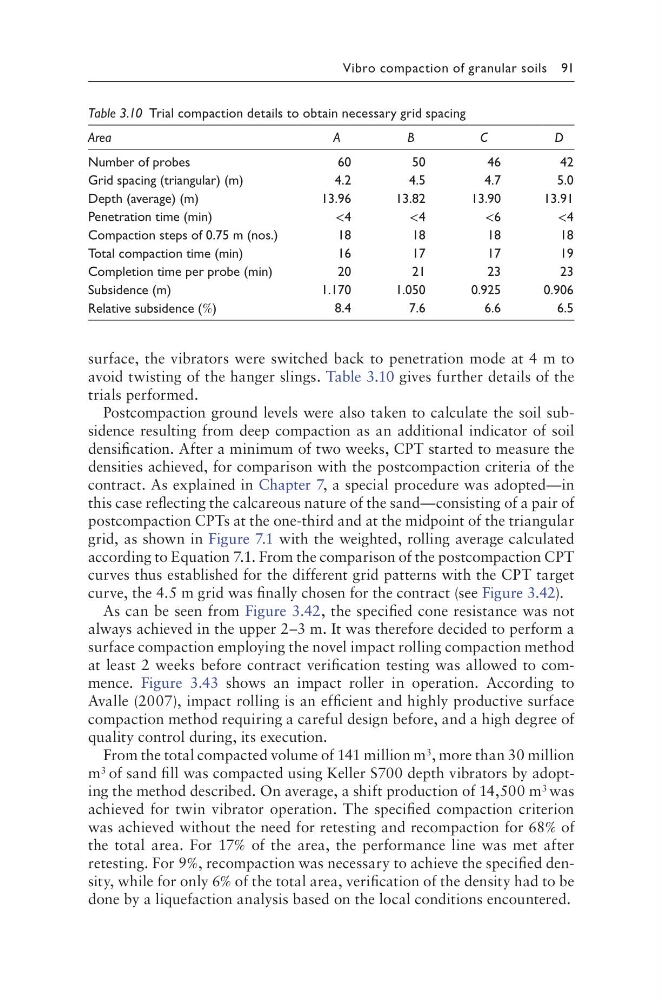
avoid twisting of the hanger slings. Table 3.10 gives further details of the
trials performed.
Postcompaction ground levels were also taken to calculate the soil subsidence resulting from deep compaction as an additional indicator of soil
densification. After a minimum of two weeks, CPT started to measure the
densities achieved, for comparison with the postcompaction criteria of the
contract. As explained in Chapter 7, a special procedure was adopted—in
this case reflecting the calcareous nature of the sand—consisting of a pair of
postcompaction CPTs at the one-third and at the midpoint of the triangular
grid, as shown in Figure 7.1 with the weighted, rolling average calculated
according to Equation 7.1. From the comparison of the postcompaction CPT
curves thus established for the different grid patterns with the CPT target
curve, the 4.5 m grid was finally chosen for the contract (see Figure 3.42).
As can be seen from Figure 3.42, the specified cone resistance was not
always achieved in the upper 2–3 m. It was therefore decided to perform a
surface compaction employing the novel impact rolling compaction method
at least 2 weeks before contract verification testing was allowed to commence. Figure 3.43 shows an impact roller in operation. According to
Avalle (2007), impact rolling is an efficient and highly productive surface
compaction method requiring a careful design before, and a high degree of
quality control during, its execution.
From the total compacted volume of 141 million m 3 , more than 30 million
m 3 of sand fill was compacted using Keller S700 depth vibrators by adopting the method described. On average, a shift production of 14,500 m 3 was
achieved for twin vibrator operation. The specified compaction criterion
was achieved without the need for retesting and recompaction for 68% of
the total area. For 17% of the area, the performance line was met after
retesting. For 9%, recompaction was necessary to achieve the specified density, while for only 6% of the total area, verification of the density had to be
done by a liquefaction analysis based on the local conditions encountered.
Table 3.10 Trial compaction details to obtain necessary grid spacing
Area
A
B
C
D
Number of probes
60
50
46
42
Grid spacing (triangular) (m)
4.2
4.5
4.7
5.0
Depth (average) (m)
13.96
13.82
13.90
13.91
Penetration time (min)
<4
<4
<6
<4
Compaction steps of 0.75 m (nos.)
18
18
18
18
Total compaction time (min)
16
17
17
19
Completion time per probe (min)
20
21
23
23
Subsidence (m)
1.170
1.050
0.925
0.906
Relative subsidence (%)
8.4
7.6
6.6
6.5
surface, the vibrators were switched back to penetration mode at 4 m to
avoid twisting of the hanger slings. Table 3.10 gives further details of the
trials performed.
Postcompaction ground levels were also taken to calculate the soil subsidence resulting from deep compaction as an additional indicator of soil
densification. After a minimum of two weeks, CPT started to measure the
densities achieved, for comparison with the postcompaction criteria of the
contract. As explained in Chapter 7, a special procedure was adopted—in
this case reflecting the calcareous nature of the sand—consisting of a pair of
postcompaction CPTs at the one-third and at the midpoint of the triangular
grid, as shown in Figure 7.1 with the weighted, rolling average calculated
according to Equation 7.1. From the comparison of the postcompaction CPT
curves thus established for the different grid patterns with the CPT target
curve, the 4.5 m grid was finally chosen for the contract (see Figure 3.42).
As can be seen from Figure 3.42, the specified cone resistance was not
always achieved in the upper 2–3 m. It was therefore decided to perform a
surface compaction employing the novel impact rolling compaction method
at least 2 weeks before contract verification testing was allowed to commence. Figure 3.43 shows an impact roller in operation. According to
Avalle (2007), impact rolling is an efficient and highly productive surface
compaction method requiring a careful design before, and a high degree of
quality control during, its execution.
From the total compacted volume of 141 million m 3 , more than 30 million
m 3 of sand fill was compacted using Keller S700 depth vibrators by adopting the method described. On average, a shift production of 14,500 m 3 was
achieved for twin vibrator operation. The specified compaction criterion
was achieved without the need for retesting and recompaction for 68% of
the total area. For 17% of the area, the performance line was met after
retesting. For 9%, recompaction was necessary to achieve the specified density, while for only 6% of the total area, verification of the density had to be
done by a liquefaction analysis based on the local conditions encountered.
Table 3.10 Trial compaction details to obtain necessary grid spacing
Area
A
B
C
D
Number of probes
60
50
46
42
Grid spacing (triangular) (m)
4.2
4.5
4.7
5.0
Depth (average) (m)
13.96
13.82
13.90
13.91
Penetration time (min)
<4
<4
<6
<4
Compaction steps of 0.75 m (nos.)
18
18
18
18
Total compaction time (min)
16
17
17
19
Completion time per probe (min)
20
21
23
23
Subsidence (m)
1.170
1.050
0.925
0.906
Relative subsidence (%)
8.4
7.6
6.6
6.5