

Vibro compaction of granular soils 89
compaction were measured for each works section. They reached on average 7% of the compaction depth with maximum values in areas of particularly clean sand of more than 10%.
3.6.3 Vibro compaction field trial in calcareous sand
On a major prestigious development project in the Middle East that was
realized between 2006 and 2009, different specialist contractors were
engaged to allow the developer to follow a very tight time schedule for his
project, in particular for the dredging operation and the following compaction works. Consequently, a variety of depth vibrators were employed which
were all tested on-site prior to the start of any contractual work. The tests
were designed to establish the required vibro probe grid spacing to achieve
the specified density as was laid down in a CPT target curve according to
Figure 3.42. Accordingly ground improvement had to be designed and conducted to ensure an allowable bearing pressure of 150 kN/m 2 at 1 m below
ground surface, total settlement (from static loads and liquefaction induced)
not to exceed 25 mm at a maximum distortion of 1:500, and to eliminate
the liquefaction risk of a design earthquake not exceeding a magnitude of
6 with a maximum ground acceleration of 0.15 g at bed rock level.
The dredged sand material was a light brownish grey to grey, shelly to
very shelly, fine to medium carbonate sand (its CaCO 3 content was more
than 90%) with many broken shell fragments smaller than 20 mm. The sand
was generally only loose to medium dense. The average depth of the manmade deposit was about 16 m, which is followed by the natural ground,
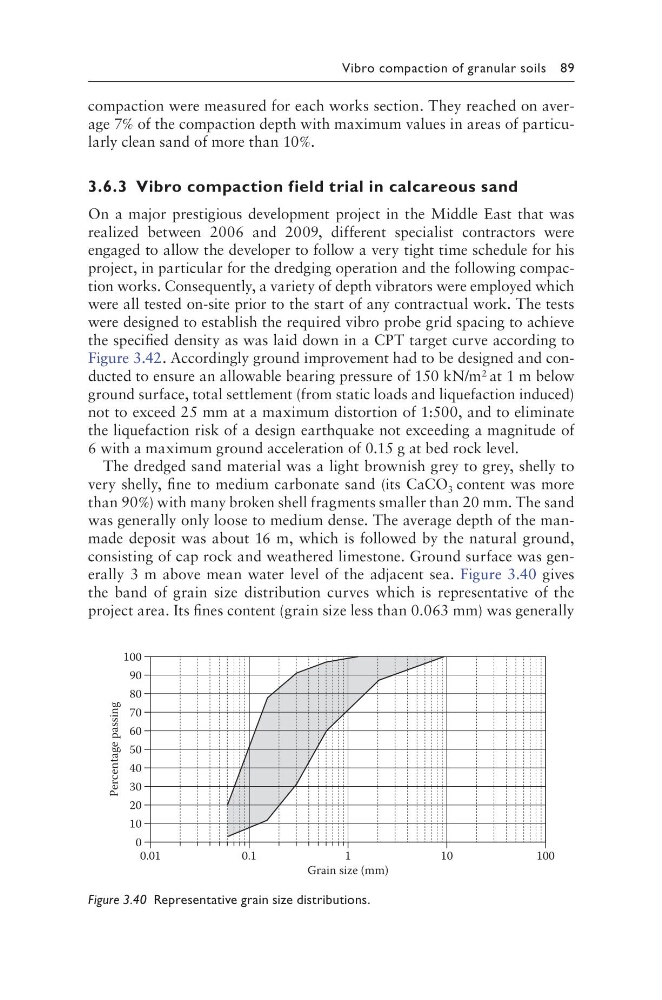
consisting of cap rock and weathered limestone. Ground surface was generally 3 m above mean water level of the adjacent sea. Figure 3.40 gives
the band of grain size distribution curves which is representative of the
project area. Its fines content (grain size less than 0.063 mm) was generally
80
60
40
20
0.01
Grain size (mm)
0.1
Percentage passing
70
50
30
10
0
90
1
100
10
100
Figure 3.40 Representative grain size distributions.
compaction were measured for each works section. They reached on average 7% of the compaction depth with maximum values in areas of particularly clean sand of more than 10%.
3.6.3 Vibro compaction field trial in calcareous sand
On a major prestigious development project in the Middle East that was
realized between 2006 and 2009, different specialist contractors were
engaged to allow the developer to follow a very tight time schedule for his
project, in particular for the dredging operation and the following compaction works. Consequently, a variety of depth vibrators were employed which
were all tested on-site prior to the start of any contractual work. The tests
were designed to establish the required vibro probe grid spacing to achieve
the specified density as was laid down in a CPT target curve according to
Figure 3.42. Accordingly ground improvement had to be designed and conducted to ensure an allowable bearing pressure of 150 kN/m 2 at 1 m below
ground surface, total settlement (from static loads and liquefaction induced)
not to exceed 25 mm at a maximum distortion of 1:500, and to eliminate
the liquefaction risk of a design earthquake not exceeding a magnitude of
6 with a maximum ground acceleration of 0.15 g at bed rock level.
The dredged sand material was a light brownish grey to grey, shelly to
very shelly, fine to medium carbonate sand (its CaCO 3 content was more
than 90%) with many broken shell fragments smaller than 20 mm. The sand
was generally only loose to medium dense. The average depth of the manmade deposit was about 16 m, which is followed by the natural ground,
consisting of cap rock and weathered limestone. Ground surface was generally 3 m above mean water level of the adjacent sea. Figure 3.40 gives
the band of grain size distribution curves which is representative of the
project area. Its fines content (grain size less than 0.063 mm) was generally
80
60
40
20
0.01
Grain size (mm)
0.1
Percentage passing
70
50
30
10
0
90
1
100
10
100
Figure 3.40 Representative grain size distributions.