

365
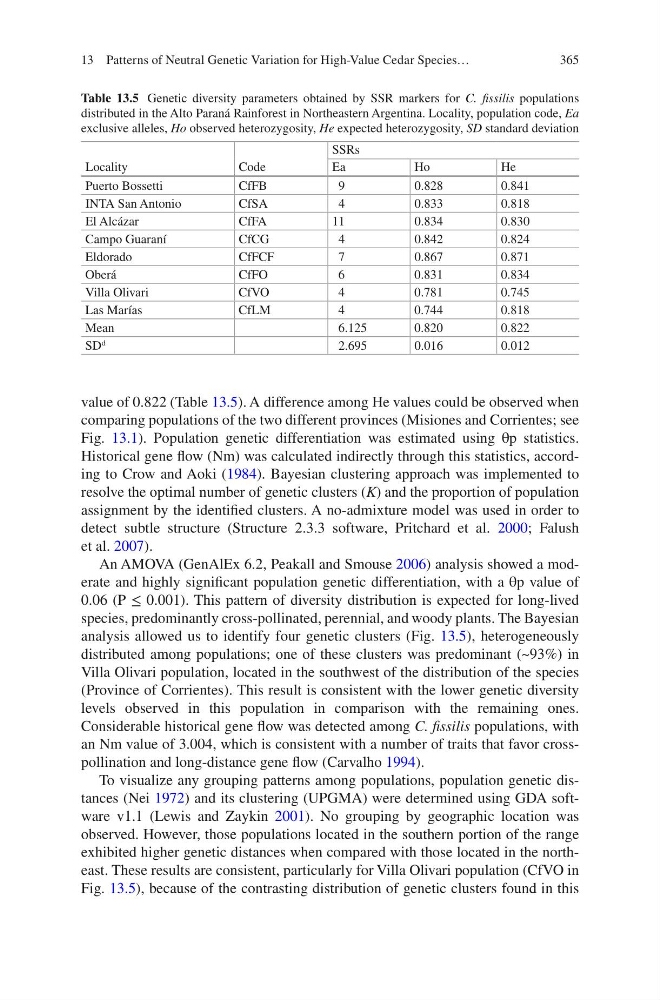
value of 0.822 (Table 13.5). A difference among He values could be observed when
comparing populations of the two different provinces (Misiones and Corrientes; see
Fig. 13.1). Population genetic differentiation was estimated using θp statistics.
Historical gene flow (Nm) was calculated indirectly through this statistics, according to Crow and Aoki (1984). Bayesian clustering approach was implemented to
resolve the optimal number of genetic clusters (K) and the proportion of population
assignment by the identified clusters. A no-admixture model was used in order to
detect subtle structure (Structure 2.3.3 software, Pritchard et al. 2000; Falush
et al. 2007).
An AMOVA (GenAlEx 6.2, Peakall and Smouse 2006) analysis showed a moderate and highly significant population genetic differentiation, with a θp value of
0.06 (P ≤ 0.001). This pattern of diversity distribution is expected for long-lived
species, predominantly cross-pollinated, perennial, and woody plants. The Bayesian
analysis allowed us to identify four genetic clusters (Fig. 13.5), heterogeneously
distributed among populations; one of these clusters was predominant (~93%) in
Villa Olivari population, located in the southwest of the distribution of the species
(Province of Corrientes). This result is consistent with the lower genetic diversity
levels observed in this population in comparison with the remaining ones.
Considerable historical gene flow was detected among C. fissilis populations, with
an Nm value of 3.004, which is consistent with a number of traits that favor crosspollination and long-distance gene flow (Carvalho 1994).
To visualize any grouping patterns among populations, population genetic distances (Nei 1972) and its clustering (UPGMA) were determined using GDA software v1.1 (Lewis and Zaykin 2001). No grouping by geographic location was
observed. However, those populations located in the southern portion of the range
exhibited higher genetic distances when compared with those located in the northeast. These results are consistent, particularly for Villa Olivari population (CfVO in
Fig. 13.5), because of the contrasting distribution of genetic clusters found in this
Table 13.5 Genetic diversity parameters obtained by SSR markers for C. fissilis populations
distributed in the Alto Paraná Rainforest in Northeastern Argentina. Locality, population code, Ea
exclusive alleles, Ho observed heterozygosity, He expected heterozygosity, SD standard deviation
Locality
Code
SSRs
Ea
Ho
He
Puerto Bossetti
CfFB
9
0.828
0.841
INTA San Antonio
CfSA
4
0.833
0.818
El Alcázar
CfFA
11
0.834
0.830
Campo Guaraní
CfCG
4
0.842
0.824
Eldorado
CfFCF
7
0.867
0.871
Oberá
CfFO
6
0.831
0.834
Villa Olivari
CfVO
4
0.781
0.745
Las Marías
CfLM
4
0.744
0.818
Mean
6.125
0.820
0.822
SD
d
2.695
0.016
0.012
13 Patterns of Neutral Genetic Variation for High-Value Cedar Species…
value of 0.822 (Table 13.5). A difference among He values could be observed when
comparing populations of the two different provinces (Misiones and Corrientes; see
Fig. 13.1). Population genetic differentiation was estimated using θp statistics.
Historical gene flow (Nm) was calculated indirectly through this statistics, according to Crow and Aoki (1984). Bayesian clustering approach was implemented to
resolve the optimal number of genetic clusters (K) and the proportion of population
assignment by the identified clusters. A no-admixture model was used in order to
detect subtle structure (Structure 2.3.3 software, Pritchard et al. 2000; Falush
et al. 2007).
An AMOVA (GenAlEx 6.2, Peakall and Smouse 2006) analysis showed a moderate and highly significant population genetic differentiation, with a θp value of
0.06 (P ≤ 0.001). This pattern of diversity distribution is expected for long-lived
species, predominantly cross-pollinated, perennial, and woody plants. The Bayesian
analysis allowed us to identify four genetic clusters (Fig. 13.5), heterogeneously
distributed among populations; one of these clusters was predominant (~93%) in
Villa Olivari population, located in the southwest of the distribution of the species
(Province of Corrientes). This result is consistent with the lower genetic diversity
levels observed in this population in comparison with the remaining ones.
Considerable historical gene flow was detected among C. fissilis populations, with
an Nm value of 3.004, which is consistent with a number of traits that favor crosspollination and long-distance gene flow (Carvalho 1994).
To visualize any grouping patterns among populations, population genetic distances (Nei 1972) and its clustering (UPGMA) were determined using GDA software v1.1 (Lewis and Zaykin 2001). No grouping by geographic location was
observed. However, those populations located in the southern portion of the range
exhibited higher genetic distances when compared with those located in the northeast. These results are consistent, particularly for Villa Olivari population (CfVO in
Fig. 13.5), because of the contrasting distribution of genetic clusters found in this
Table 13.5 Genetic diversity parameters obtained by SSR markers for C. fissilis populations
distributed in the Alto Paraná Rainforest in Northeastern Argentina. Locality, population code, Ea
exclusive alleles, Ho observed heterozygosity, He expected heterozygosity, SD standard deviation
Locality
Code
SSRs
Ea
Ho
He
Puerto Bossetti
CfFB
9
0.828
0.841
INTA San Antonio
CfSA
4
0.833
0.818
El Alcázar
CfFA
11
0.834
0.830
Campo Guaraní
CfCG
4
0.842
0.824
Eldorado
CfFCF
7
0.867
0.871
Oberá
CfFO
6
0.831
0.834
Villa Olivari
CfVO
4
0.781
0.745
Las Marías
CfLM
4
0.744
0.818
Mean
6.125
0.820
0.822
SD
d
2.695
0.016
0.012
13 Patterns of Neutral Genetic Variation for High-Value Cedar Species…