

355
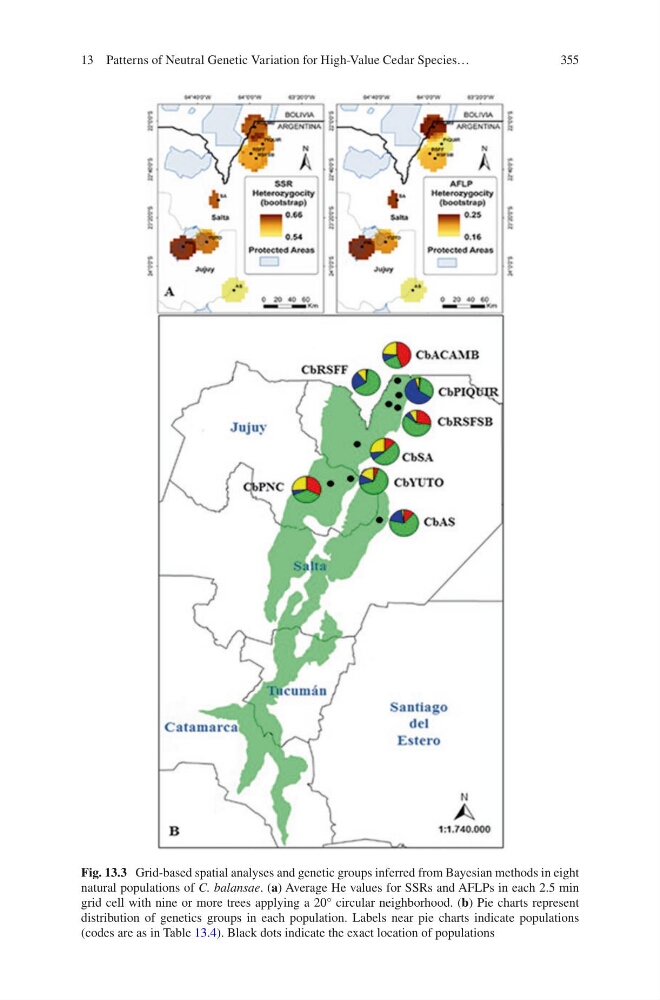
Fig. 13.3 Grid-based spatial analyses and genetic groups inferred from Bayesian methods in eight
natural populations of C. balansae. (a) Average He values for SSRs and AFLPs in each 2.5 min
grid cell with nine or more trees applying a 20° circular neighborhood. (b) Pie charts represent
distribution of genetics groups in each population. Labels near pie charts indicate populations
(codes are as in Table 13.4). Black dots indicate the exact location of populations
13 Patterns of Neutral Genetic Variation for High-Value Cedar Species…
Fig. 13.3 Grid-based spatial analyses and genetic groups inferred from Bayesian methods in eight
natural populations of C. balansae. (a) Average He values for SSRs and AFLPs in each 2.5 min
grid cell with nine or more trees applying a 20° circular neighborhood. (b) Pie charts represent
distribution of genetics groups in each population. Labels near pie charts indicate populations
(codes are as in Table 13.4). Black dots indicate the exact location of populations
13 Patterns of Neutral Genetic Variation for High-Value Cedar Species…