

353
13.2.2 Molecular Genetic Variability of Cedrela balansae
in the Yungas
Little information is available about the genetic diversity of C. balansae, despite its
ecological and economic importance. In order to provide information about the
genetic variation of the species as a prerequisite to start breeding and conservation
programs, genomic analyses combining both SSRs (simple sequence repeats) and
AFLP markers were carried out (Soldati et al. 2013).
Young leaves from 107 adult trees randomly chosen were collected throughout
the north and center of the Yungas in NWA, representing eight remnant natural populations covering the distribution area of the species in Argentina. For genomic
DNA extraction and molecular marker procedures, see Soldati et al. (2013). Since
no SSR markers have been reported in C. balansae so far, we tested the transferability of 45 SSRs developed in phylogenetically close species belonging to the
Meliaceae family: (i) 21 primer pairs of SSRs developed for C. odorata; (ii) 6
primer pairs developed for C. fissilis; (iii) 10 primer pairs developed for Swietenia
macrophylla; and (iv) 8 primer pairs developed for Swietenia humilis. Thirty primer
pairs successfully amplified putatively homologous SSR loci in C. balansae, 12 of
them were pre-selected based on clearness of resolution patterns and polymorphism
levels. Null alleles were found in 10 of the 20 markers, but only reached values
greater than 0.05 in 5 loci. The remaining 7 loci (i.e., Ced2, Ced41, Ced44, Ced61a,
Ced95, CF66, and CF78) showed no significant proportion of null alleles (P < 0.05),
and none of them revealed significant deviations from HWE (Hardy-Weinberg
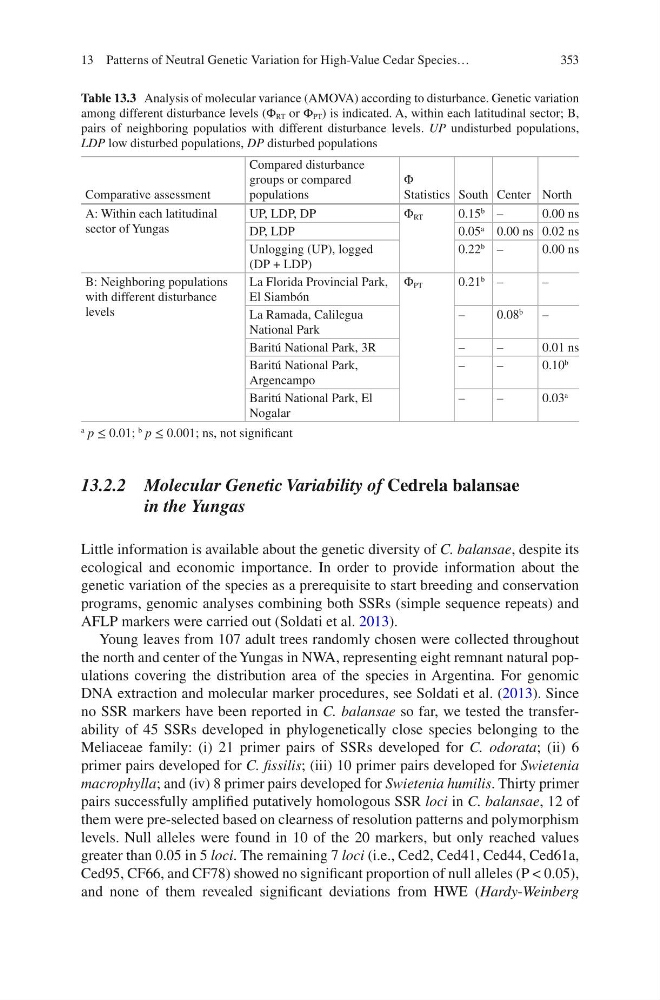
Table 13.3 Analysis of molecular variance (AMOVA) according to disturbance. Genetic variation
among different disturbance levels (Φ RT or Φ PT ) is indicated. A, within each latitudinal sector; B,
pairs of neighboring populatios with different disturbance levels. UP undisturbed populations,
LDP low disturbed populations, DP disturbed populations
Comparative assessment
Compared disturbance
groups or compared
populations
Φ
Statistics South Center North
A: Within each latitudinal
sector of Yungas
UP, LDP, DP
Φ RT
0.15
b
–
0.00 ns
DP, LDP
0.05
a
0.00 ns 0.02 ns
Unlogging (UP), logged
(DP + LDP)
0.22
b
–
0.00 ns
B: Neighboring populations
with different disturbance
levels
La Florida Provincial Park,
El Siambón
Φ PT
0.21
b
–
–
La Ramada, Calilegua
National Park
–
0.08
b
–
Baritú National Park, 3R
–
–
0.01 ns
Baritú National Park,
Argencampo
–
–
0.10
b
Baritú National Park, El
Nogalar
–
–
0.03
a
a p ≤ 0.01;
b p ≤ 0.001; ns, not significant
13 Patterns of Neutral Genetic Variation for High-Value Cedar Species…
13.2.2 Molecular Genetic Variability of Cedrela balansae
in the Yungas
Little information is available about the genetic diversity of C. balansae, despite its
ecological and economic importance. In order to provide information about the
genetic variation of the species as a prerequisite to start breeding and conservation
programs, genomic analyses combining both SSRs (simple sequence repeats) and
AFLP markers were carried out (Soldati et al. 2013).
Young leaves from 107 adult trees randomly chosen were collected throughout
the north and center of the Yungas in NWA, representing eight remnant natural populations covering the distribution area of the species in Argentina. For genomic
DNA extraction and molecular marker procedures, see Soldati et al. (2013). Since
no SSR markers have been reported in C. balansae so far, we tested the transferability of 45 SSRs developed in phylogenetically close species belonging to the
Meliaceae family: (i) 21 primer pairs of SSRs developed for C. odorata; (ii) 6
primer pairs developed for C. fissilis; (iii) 10 primer pairs developed for Swietenia
macrophylla; and (iv) 8 primer pairs developed for Swietenia humilis. Thirty primer
pairs successfully amplified putatively homologous SSR loci in C. balansae, 12 of
them were pre-selected based on clearness of resolution patterns and polymorphism
levels. Null alleles were found in 10 of the 20 markers, but only reached values
greater than 0.05 in 5 loci. The remaining 7 loci (i.e., Ced2, Ced41, Ced44, Ced61a,
Ced95, CF66, and CF78) showed no significant proportion of null alleles (P < 0.05),
and none of them revealed significant deviations from HWE (Hardy-Weinberg
Table 13.3 Analysis of molecular variance (AMOVA) according to disturbance. Genetic variation
among different disturbance levels (Φ RT or Φ PT ) is indicated. A, within each latitudinal sector; B,
pairs of neighboring populatios with different disturbance levels. UP undisturbed populations,
LDP low disturbed populations, DP disturbed populations
Comparative assessment
Compared disturbance
groups or compared
populations
Φ
Statistics South Center North
A: Within each latitudinal
sector of Yungas
UP, LDP, DP
Φ RT
0.15
b
–
0.00 ns
DP, LDP
0.05
a
0.00 ns 0.02 ns
Unlogging (UP), logged
(DP + LDP)
0.22
b
–
0.00 ns
B: Neighboring populations
with different disturbance
levels
La Florida Provincial Park,
El Siambón
Φ PT
0.21
b
–
–
La Ramada, Calilegua
National Park
–
0.08
b
–
Baritú National Park, 3R
–
–
0.01 ns
Baritú National Park,
Argencampo
–
–
0.10
b
Baritú National Park, El
Nogalar
–
–
0.03
a
a p ≤ 0.01;
b p ≤ 0.001; ns, not significant
13 Patterns of Neutral Genetic Variation for High-Value Cedar Species…