

256
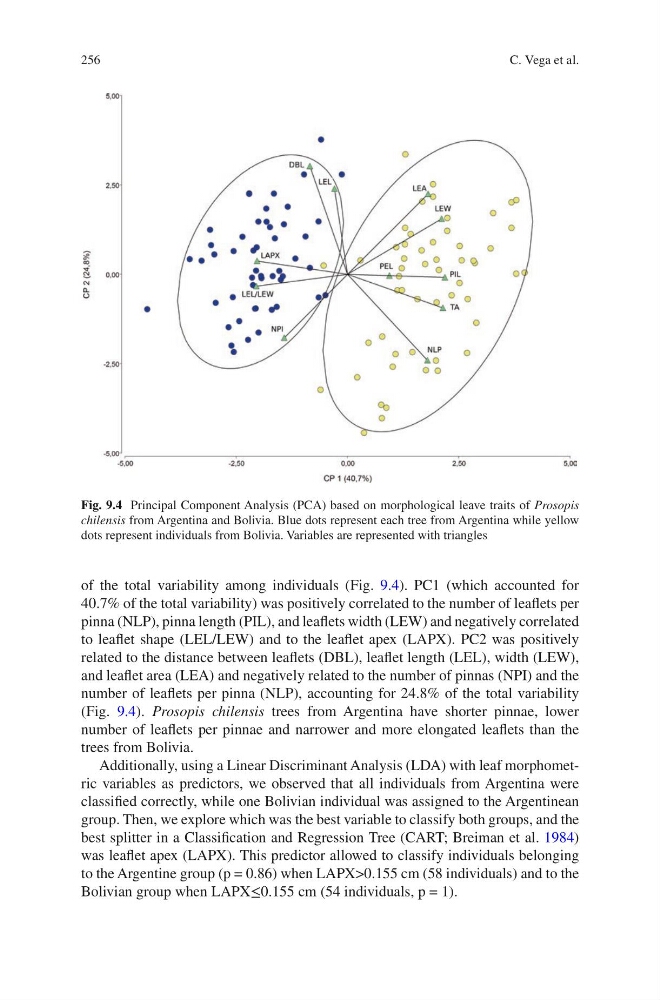
of the total variability among individuals (Fig. 9.4). PC1 (which accounted for
40.7% of the total variability) was positively correlated to the number of leaflets per
pinna (NLP), pinna length (PIL), and leaflets width (LEW) and negatively correlated
to leaflet shape (LEL/LEW) and to the leaflet apex (LAPX). PC2 was positively
related to the distance between leaflets (DBL), leaflet length (LEL), width (LEW),
and leaflet area (LEA) and negatively related to the number of pinnas (NPI) and the
number of leaflets per pinna (NLP), accounting for 24.8% of the total variability
(Fig. 9.4). Prosopis chilensis trees from Argentina have shorter pinnae, lower
number of leaflets per pinnae and narrower and more elongated leaflets than the
trees from Bolivia.
Additionally, using a Linear Discriminant Analysis (LDA) with leaf morphometric variables as predictors, we observed that all individuals from Argentina were
classified correctly, while one Bolivian individual was assigned to the Argentinean
group. Then, we explore which was the best variable to classify both groups, and the
best splitter in a Classification and Regression Tree (CART; Breiman et al. 1984)
was leaflet apex (LAPX). This predictor allowed to classify individuals belonging
to the Argentine group (p = 0.86) when LAPX>0.155 cm (58 individuals) and to the
Bolivian group when LAPX≤0.155 cm (54 individuals, p = 1).
Fig. 9.4 Principal Component Analysis (PCA) based on morphological leave traits of Prosopis
chilensis from Argentina and Bolivia. Blue dots represent each tree from Argentina while yellow
dots represent individuals from Bolivia. Variables are represented with triangles
C. Vega et al.
of the total variability among individuals (Fig. 9.4). PC1 (which accounted for
40.7% of the total variability) was positively correlated to the number of leaflets per
pinna (NLP), pinna length (PIL), and leaflets width (LEW) and negatively correlated
to leaflet shape (LEL/LEW) and to the leaflet apex (LAPX). PC2 was positively
related to the distance between leaflets (DBL), leaflet length (LEL), width (LEW),
and leaflet area (LEA) and negatively related to the number of pinnas (NPI) and the
number of leaflets per pinna (NLP), accounting for 24.8% of the total variability
(Fig. 9.4). Prosopis chilensis trees from Argentina have shorter pinnae, lower
number of leaflets per pinnae and narrower and more elongated leaflets than the
trees from Bolivia.
Additionally, using a Linear Discriminant Analysis (LDA) with leaf morphometric variables as predictors, we observed that all individuals from Argentina were
classified correctly, while one Bolivian individual was assigned to the Argentinean
group. Then, we explore which was the best variable to classify both groups, and the
best splitter in a Classification and Regression Tree (CART; Breiman et al. 1984)
was leaflet apex (LAPX). This predictor allowed to classify individuals belonging
to the Argentine group (p = 0.86) when LAPX>0.155 cm (58 individuals) and to the
Bolivian group when LAPX≤0.155 cm (54 individuals, p = 1).
Fig. 9.4 Principal Component Analysis (PCA) based on morphological leave traits of Prosopis
chilensis from Argentina and Bolivia. Blue dots represent each tree from Argentina while yellow
dots represent individuals from Bolivia. Variables are represented with triangles
C. Vega et al.