

187
correlated with height in seedlings of 2 and 3 years (Izquierdo and Gallo 2006), and
therefore, maternal effects could be causing an overestimation of the heritability.
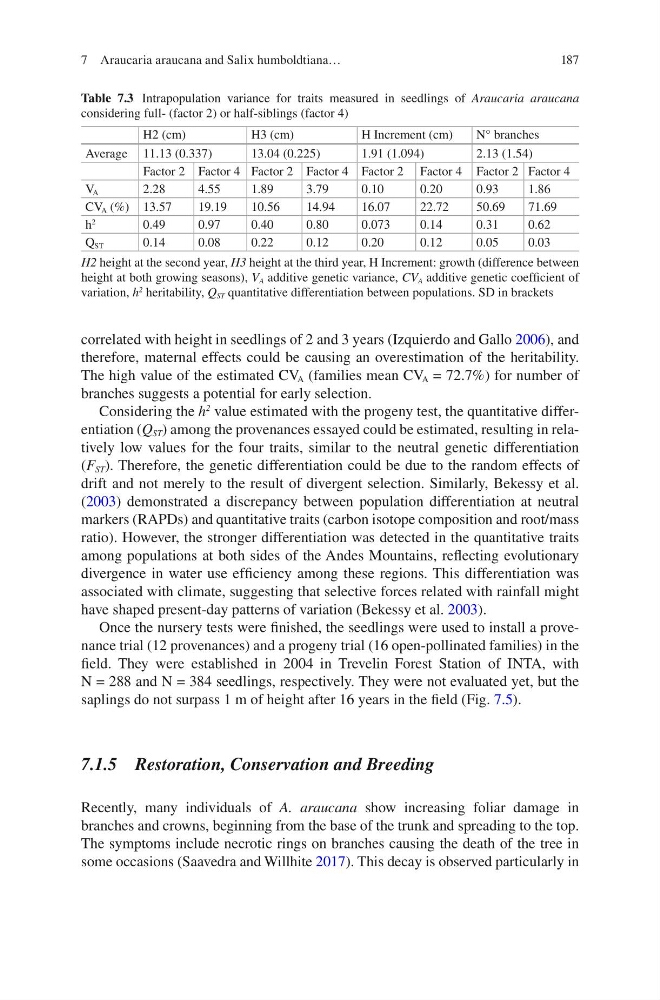
The high value of the estimated CV A (families mean CV A = 72.7%) for number of
branches suggests a potential for early selection.
Considering the h
2
value estimated with the progeny test, the quantitative differentiation (Q ST ) among the provenances essayed could be estimated, resulting in relatively low values for the four traits, similar to the neutral genetic differentiation
(F ST ). Therefore, the genetic differentiation could be due to the random effects of
drift and not merely to the result of divergent selection. Similarly, Bekessy et al.
(2003) demonstrated a discrepancy between population differentiation at neutral
markers (RAPDs) and quantitative traits (carbon isotope composition and root/mass
ratio). However, the stronger differentiation was detected in the quantitative traits
among populations at both sides of the Andes Mountains, reflecting evolutionary
divergence in water use efficiency among these regions. This differentiation was
associated with climate, suggesting that selective forces related with rainfall might
have shaped present-day patterns of variation (Bekessy et al. 2003).
Once the nursery tests were finished, the seedlings were used to install a provenance trial (12 provenances) and a progeny trial (16 open- pollinated families) in the
field. They were established in 2004 in Trevelin Forest Station of INTA, with
N = 288 and N = 384 seedlings, respectively. They were not evaluated yet, but the
saplings do not surpass 1 m of height after 16 years in the field (Fig. 7.5).
7.1.5 Restoration, Conservation and Breeding
Recently, many individuals of A. araucana show increasing foliar damage in
branches and crowns, beginning from the base of the trunk and spreading to the top.
The symptoms include necrotic rings on branches causing the death of the tree in
some occasions (Saavedra and Willhite 2017). This decay is observed particularly in
Table 7.3 Intrapopulation variance for traits measured in seedlings of Araucaria araucana
considering full- (factor 2) or half-siblings (factor 4)
H2 (cm)
H3 (cm)
H Increment (cm)
N° branches
Average 11.13 (0.337)
13.04 (0.225)
1.91 (1.094)
2.13 (1.54)
Factor 2 Factor 4 Factor 2 Factor 4 Factor 2 Factor 4 Factor 2 Factor 4
V A
2.28
4.55
1.89
3.79
0.10
0.20
0.93
1.86
CV A (%) 13.57
19.19
10.56
14.94
16.07
22.72
50.69
71.69
h
2
0.49
0.97
0.40
0.80
0.073
0.14
0.31
0.62
Q ST
0.14
0.08
0.22
0.12
0.20
0.12
0.05
0.03
H2 height at the second year, H3 height at the third year, H Increment: growth (difference between
height at both growing seasons), V A additive genetic variance, CV A additive genetic coefficient of
variation, h
2 heritability, Q ST quantitative differentiation between populations. SD in brackets
7 Araucaria araucana and Salix humboldtiana…
correlated with height in seedlings of 2 and 3 years (Izquierdo and Gallo 2006), and
therefore, maternal effects could be causing an overestimation of the heritability.
The high value of the estimated CV A (families mean CV A = 72.7%) for number of
branches suggests a potential for early selection.
Considering the h
2
value estimated with the progeny test, the quantitative differentiation (Q ST ) among the provenances essayed could be estimated, resulting in relatively low values for the four traits, similar to the neutral genetic differentiation
(F ST ). Therefore, the genetic differentiation could be due to the random effects of
drift and not merely to the result of divergent selection. Similarly, Bekessy et al.
(2003) demonstrated a discrepancy between population differentiation at neutral
markers (RAPDs) and quantitative traits (carbon isotope composition and root/mass
ratio). However, the stronger differentiation was detected in the quantitative traits
among populations at both sides of the Andes Mountains, reflecting evolutionary
divergence in water use efficiency among these regions. This differentiation was
associated with climate, suggesting that selective forces related with rainfall might
have shaped present-day patterns of variation (Bekessy et al. 2003).
Once the nursery tests were finished, the seedlings were used to install a provenance trial (12 provenances) and a progeny trial (16 open- pollinated families) in the
field. They were established in 2004 in Trevelin Forest Station of INTA, with
N = 288 and N = 384 seedlings, respectively. They were not evaluated yet, but the
saplings do not surpass 1 m of height after 16 years in the field (Fig. 7.5).
7.1.5 Restoration, Conservation and Breeding
Recently, many individuals of A. araucana show increasing foliar damage in
branches and crowns, beginning from the base of the trunk and spreading to the top.
The symptoms include necrotic rings on branches causing the death of the tree in
some occasions (Saavedra and Willhite 2017). This decay is observed particularly in
Table 7.3 Intrapopulation variance for traits measured in seedlings of Araucaria araucana
considering full- (factor 2) or half-siblings (factor 4)
H2 (cm)
H3 (cm)
H Increment (cm)
N° branches
Average 11.13 (0.337)
13.04 (0.225)
1.91 (1.094)
2.13 (1.54)
Factor 2 Factor 4 Factor 2 Factor 4 Factor 2 Factor 4 Factor 2 Factor 4
V A
2.28
4.55
1.89
3.79
0.10
0.20
0.93
1.86
CV A (%) 13.57
19.19
10.56
14.94
16.07
22.72
50.69
71.69
h
2
0.49
0.97
0.40
0.80
0.073
0.14
0.31
0.62
Q ST
0.14
0.08
0.22
0.12
0.20
0.12
0.05
0.03
H2 height at the second year, H3 height at the third year, H Increment: growth (difference between
height at both growing seasons), V A additive genetic variance, CV A additive genetic coefficient of
variation, h
2 heritability, Q ST quantitative differentiation between populations. SD in brackets
7 Araucaria araucana and Salix humboldtiana…