

164
scale. Nevertheless, an alternative (or complementary) explanation would be that
the estimates of the additive variance were inflated by maternal effects, which could
cause in turn the Q ST value to have been underestimated. Given the significant effect
of population as an explanatory variable and association between the mean branching degree and population altitude, it seems reasonable to assume that there is a
tendency for ecotypic regional structuring, modeled by ecological factors associated with geographic altitude. Probably, due to a higher probability of interspecific
competition, populations of lower altitudes tend to a more branched mean phenotype.
The synchronization of the annual growth rhythm with the environment is critical in temperate trees, since it determines complex trade-offs between competitive
ability and survival, in particular during seedling recruitment (Howe et al. 2003;
Green 2005; Notivol et al. 2007). To understand how the genetic variation of the
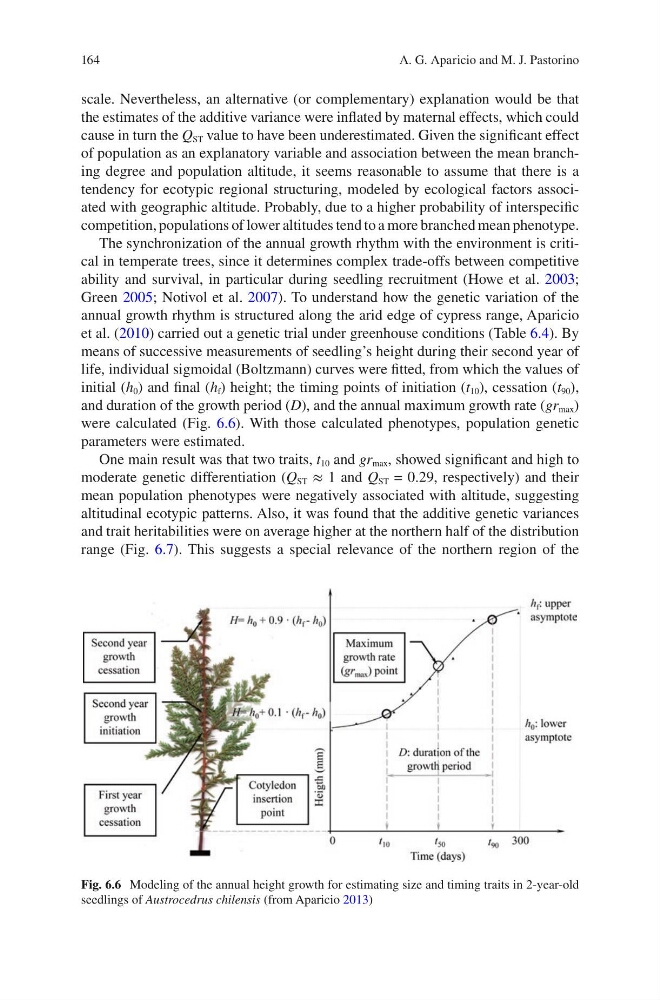
annual growth rhythm is structured along the arid edge of cypress range, Aparicio
et al. (2010) carried out a genetic trial under greenhouse conditions (Table 6.4). By
means of successive measurements of seedling’s height during their second year of
life, individual sigmoidal (Boltzmann) curves were fitted, from which the values of
initial (h 0 ) and final (h f ) height; the timing points of initiation (t 10 ), cessation (t 90 ),
and duration of the growth period (D), and the annual maximum growth rate (gr max )
were calculated (Fig. 6.6). With those calculated phenotypes, population genetic
parameters were estimated.
One main result was that two traits, t 10 and gr max , showed significant and high to
moderate genetic differentiation (Q ST ≈ 1 and Q ST = 0.29, respectively) and their
mean population phenotypes were negatively associated with altitude, suggesting
altitudinal ecotypic patterns. Also, it was found that the additive genetic variances
and trait heritabilities were on average higher at the northern half of the distribution
range (Fig. 6.7). This suggests a special relevance of the northern region of the
Fig. 6.6 Modeling of the annual height growth for estimating size and timing traits in 2-year-old
seedlings of Austrocedrus chilensis (from Aparicio 2013)
A. G. Aparicio and M. J. Pastorino
scale. Nevertheless, an alternative (or complementary) explanation would be that
the estimates of the additive variance were inflated by maternal effects, which could
cause in turn the Q ST value to have been underestimated. Given the significant effect
of population as an explanatory variable and association between the mean branching degree and population altitude, it seems reasonable to assume that there is a
tendency for ecotypic regional structuring, modeled by ecological factors associated with geographic altitude. Probably, due to a higher probability of interspecific
competition, populations of lower altitudes tend to a more branched mean phenotype.
The synchronization of the annual growth rhythm with the environment is critical in temperate trees, since it determines complex trade-offs between competitive
ability and survival, in particular during seedling recruitment (Howe et al. 2003;
Green 2005; Notivol et al. 2007). To understand how the genetic variation of the
annual growth rhythm is structured along the arid edge of cypress range, Aparicio
et al. (2010) carried out a genetic trial under greenhouse conditions (Table 6.4). By
means of successive measurements of seedling’s height during their second year of
life, individual sigmoidal (Boltzmann) curves were fitted, from which the values of
initial (h 0 ) and final (h f ) height; the timing points of initiation (t 10 ), cessation (t 90 ),
and duration of the growth period (D), and the annual maximum growth rate (gr max )
were calculated (Fig. 6.6). With those calculated phenotypes, population genetic
parameters were estimated.
One main result was that two traits, t 10 and gr max , showed significant and high to
moderate genetic differentiation (Q ST ≈ 1 and Q ST = 0.29, respectively) and their
mean population phenotypes were negatively associated with altitude, suggesting
altitudinal ecotypic patterns. Also, it was found that the additive genetic variances
and trait heritabilities were on average higher at the northern half of the distribution
range (Fig. 6.7). This suggests a special relevance of the northern region of the
Fig. 6.6 Modeling of the annual height growth for estimating size and timing traits in 2-year-old
seedlings of Austrocedrus chilensis (from Aparicio 2013)
A. G. Aparicio and M. J. Pastorino