

124
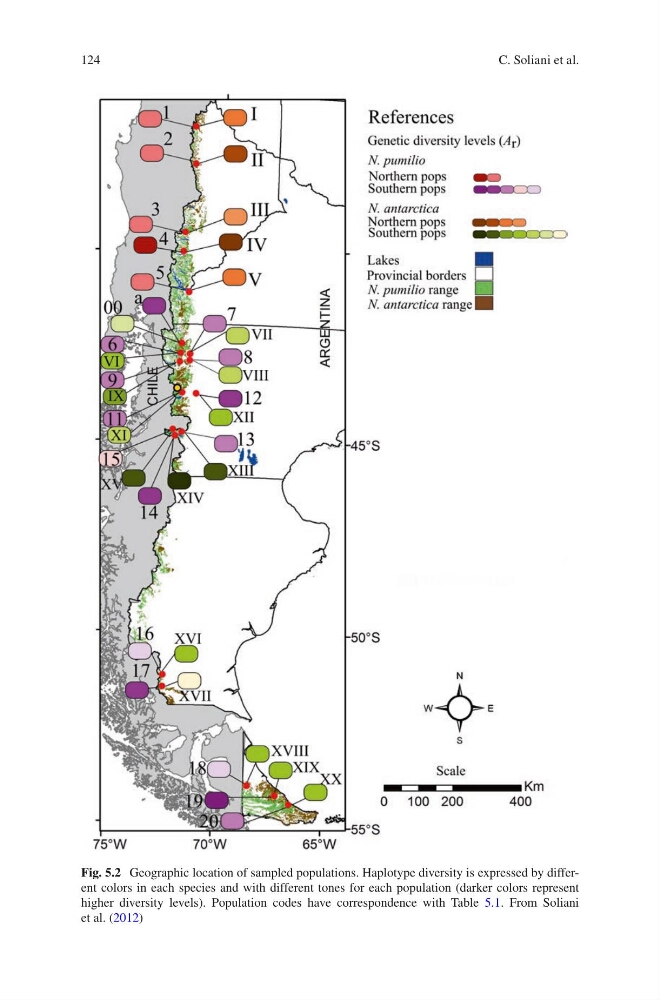
Fig. 5.2 Geographic location of sampled populations. Haplotype diversity is expressed by different colors in each species and with different tones for each population (darker colors represent
higher diversity levels). Population codes have correspondence with Table 5.1. From Soliani
et al. (2012)
C. Soliani et al.
Fig. 5.2 Geographic location of sampled populations. Haplotype diversity is expressed by different colors in each species and with different tones for each population (darker colors represent
higher diversity levels). Population codes have correspondence with Table 5.1. From Soliani
et al. (2012)
C. Soliani et al.