

123
hybridization. Ecological features also support hybridization in our species complex:
flowering phenology and pollen release overlap (González et al. 2006), although
other pre- and even post-zygotic barriers can also occur. The predominance of westerlies in the region and the altitudinal ecological gradient formed by both species
might favor N. antarctica acting as the mother tree. However, the lack of evidence
supporting backcrosses of hybrids toward N. antarctica as the parental species and
the scarce genetic information about F1 and F2 generations do not allow to thoroughly conclude about the directionality of the hybridization. Moreover, since individuals from both species coexist in some places, hybridization and directionality of
the crosses (hybrids to parental species) could vary according to the relative abundance of the taxa (Lepais et al. 2009) or particular conditions of the site where they
co-occur (e.g., Heuertz et al. 2006).
5.3 Genetic Structure at Nuclear Markers Across
Species Ranges
5.3.1 Latitudinal Trends, Species Admixture,
and the Identification of a Contact Zone
In addition to the phylogeographical analysis presented in the previous section, the
same 20 pairs of populations of sympatric interspecific natural forests were studied
with seven microsatellite loci in N. pumilio and six in N. antarctica (Soliani et al.
2010) (five shared by both species). Besides, one sample from a single N. antarctica
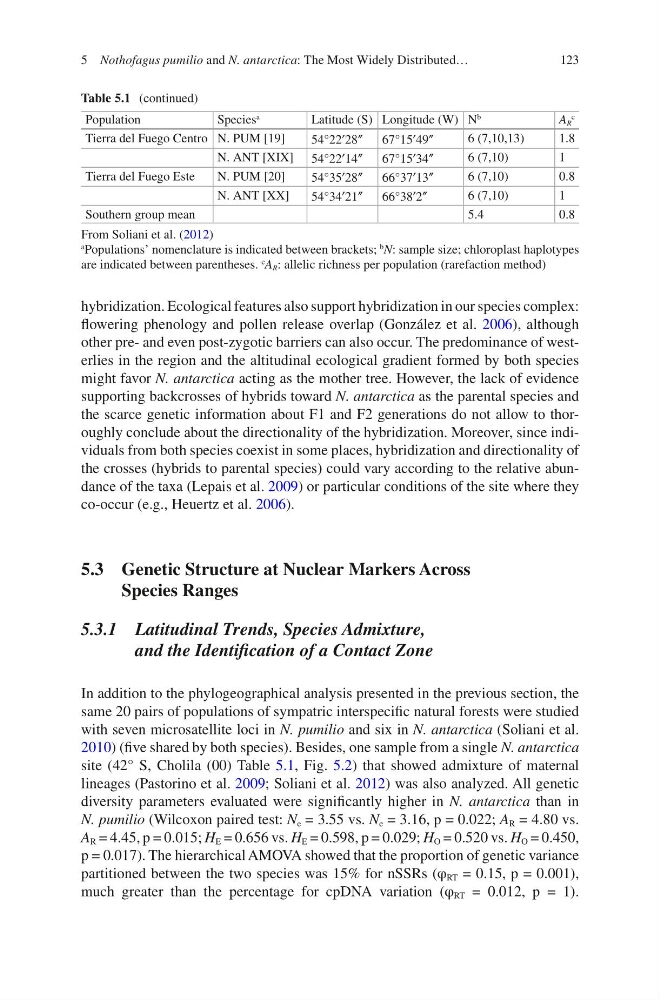
site (42° S, Cholila (00) Table 5.1, Fig. 5.2) that showed admixture of maternal
lineages (Pastorino et al. 2009; Soliani et al. 2012) was also analyzed. All genetic
diversity parameters evaluated were significantly higher in N. antarctica than in
N. pumilio (Wilcoxon paired test: N e = 3.55 vs. N e = 3.16, p = 0.022; A R = 4.80 vs.
A R = 4.45, p = 0.015; H E = 0.656 vs. H E = 0.598, p = 0.029; H O = 0.520 vs. H O = 0.450,
p = 0.017). The hierarchical AMOVA showed that the proportion of genetic variance
partitioned between the two species was 15% for nSSRs (φ RT = 0.15, p = 0.001),
much greater than the percentage for cpDNA variation (φ RT = 0.012, p = 1).
Table 5.1 (continued)
Population
Species
a
Latitude (S) Longitude (W) N
b
A R
c
Tierra del Fuego Centro N. PUM [19]
54°22′28″
67°15′49″
6 (7,10,13)
1.8
N. ANT [XIX] 54°22′14″
67°15′34″
6 (7,10)
1
Tierra del Fuego Este
N. PUM [20]
54°35′28″
66°37′13″
6 (7,10)
0.8
N. ANT [XX]
54°34′21″
66°38′2″
6 (7,10)
1
Southern group mean
5.4
0.8
From Soliani et al. (2012)
a
Populations’ nomenclature is indicated between brackets;
b N: sample size; chloroplast haplotypes
are indicated between parentheses.
c
A R : allelic richness per population (rarefaction method)
5 Nothofagus pumilio and N. antarctica: The Most Widely Distributed…
hybridization. Ecological features also support hybridization in our species complex:
flowering phenology and pollen release overlap (González et al. 2006), although
other pre- and even post-zygotic barriers can also occur. The predominance of westerlies in the region and the altitudinal ecological gradient formed by both species
might favor N. antarctica acting as the mother tree. However, the lack of evidence
supporting backcrosses of hybrids toward N. antarctica as the parental species and
the scarce genetic information about F1 and F2 generations do not allow to thoroughly conclude about the directionality of the hybridization. Moreover, since individuals from both species coexist in some places, hybridization and directionality of
the crosses (hybrids to parental species) could vary according to the relative abundance of the taxa (Lepais et al. 2009) or particular conditions of the site where they
co-occur (e.g., Heuertz et al. 2006).
5.3 Genetic Structure at Nuclear Markers Across
Species Ranges
5.3.1 Latitudinal Trends, Species Admixture,
and the Identification of a Contact Zone
In addition to the phylogeographical analysis presented in the previous section, the
same 20 pairs of populations of sympatric interspecific natural forests were studied
with seven microsatellite loci in N. pumilio and six in N. antarctica (Soliani et al.
2010) (five shared by both species). Besides, one sample from a single N. antarctica
site (42° S, Cholila (00) Table 5.1, Fig. 5.2) that showed admixture of maternal
lineages (Pastorino et al. 2009; Soliani et al. 2012) was also analyzed. All genetic
diversity parameters evaluated were significantly higher in N. antarctica than in
N. pumilio (Wilcoxon paired test: N e = 3.55 vs. N e = 3.16, p = 0.022; A R = 4.80 vs.
A R = 4.45, p = 0.015; H E = 0.656 vs. H E = 0.598, p = 0.029; H O = 0.520 vs. H O = 0.450,
p = 0.017). The hierarchical AMOVA showed that the proportion of genetic variance
partitioned between the two species was 15% for nSSRs (φ RT = 0.15, p = 0.001),
much greater than the percentage for cpDNA variation (φ RT = 0.012, p = 1).
Table 5.1 (continued)
Population
Species
a
Latitude (S) Longitude (W) N
b
A R
c
Tierra del Fuego Centro N. PUM [19]
54°22′28″
67°15′49″
6 (7,10,13)
1.8
N. ANT [XIX] 54°22′14″
67°15′34″
6 (7,10)
1
Tierra del Fuego Este
N. PUM [20]
54°35′28″
66°37′13″
6 (7,10)
0.8
N. ANT [XX]
54°34′21″
66°38′2″
6 (7,10)
1
Southern group mean
5.4
0.8
From Soliani et al. (2012)
a
Populations’ nomenclature is indicated between brackets;
b N: sample size; chloroplast haplotypes
are indicated between parentheses.
c
A R : allelic richness per population (rarefaction method)
5 Nothofagus pumilio and N. antarctica: The Most Widely Distributed…