

2. Once the VCF file is generated:
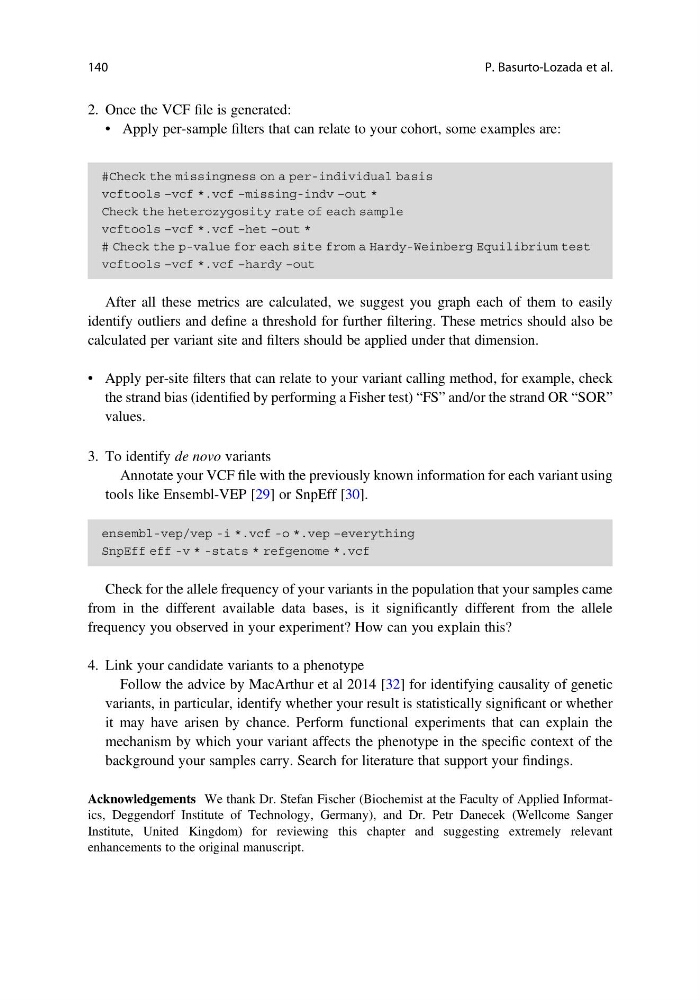
• Apply per-sample filters that can relate to your cohort, some examples are:
After all these metrics are calculated, we suggest you graph each of them to easily
identify outliers and define a threshold for further filtering. These metrics should also be
calculated per variant site and filters should be applied under that dimension.
• Apply per-site filters that can relate to your variant calling method, for example, check
the strand bias (identified by performing a Fisher test) “FS” and/or the strand OR “SOR”
values.
3. To identify de novo variants
Annotate your VCF file with the previously known information for each variant using
tools like Ensembl-VEP [29] or SnpEff [30].
Check for the allele frequency of your variants in the population that your samples came
from in the different available data bases, is it significantly different from the allele
frequency you observed in your experiment? How can you explain this?
4. Link your candidate variants to a phenotype
Follow the advice by MacArthur et al 2014 [32] for identifying causality of genetic
variants, in particular, identify whether your result is statistically significant or whether
it may have arisen by chance. Perform functional experiments that can explain the
mechanism by which your variant affects the phenotype in the specific context of the
background your samples carry. Search for literature that support your findings.
Acknowledgements We thank Dr. Stefan Fischer (Biochemist at the Faculty of Applied Informatics, Deggendorf Institute of Technology, Germany), and Dr. Petr Danecek (Wellcome Sanger
Institute, United Kingdom) for reviewing this chapter and suggesting extremely relevant
enhancements to the original manuscript.
140
P. Basurto-Lozada et al.
• Apply per-sample filters that can relate to your cohort, some examples are:
After all these metrics are calculated, we suggest you graph each of them to easily
identify outliers and define a threshold for further filtering. These metrics should also be
calculated per variant site and filters should be applied under that dimension.
• Apply per-site filters that can relate to your variant calling method, for example, check
the strand bias (identified by performing a Fisher test) “FS” and/or the strand OR “SOR”
values.
3. To identify de novo variants
Annotate your VCF file with the previously known information for each variant using
tools like Ensembl-VEP [29] or SnpEff [30].
Check for the allele frequency of your variants in the population that your samples came
from in the different available data bases, is it significantly different from the allele
frequency you observed in your experiment? How can you explain this?
4. Link your candidate variants to a phenotype
Follow the advice by MacArthur et al 2014 [32] for identifying causality of genetic
variants, in particular, identify whether your result is statistically significant or whether
it may have arisen by chance. Perform functional experiments that can explain the
mechanism by which your variant affects the phenotype in the specific context of the
background your samples carry. Search for literature that support your findings.
Acknowledgements We thank Dr. Stefan Fischer (Biochemist at the Faculty of Applied Informatics, Deggendorf Institute of Technology, Germany), and Dr. Petr Danecek (Wellcome Sanger
Institute, United Kingdom) for reviewing this chapter and suggesting extremely relevant
enhancements to the original manuscript.
140
P. Basurto-Lozada et al.