

7.3.1.7 Per Sequence GC content
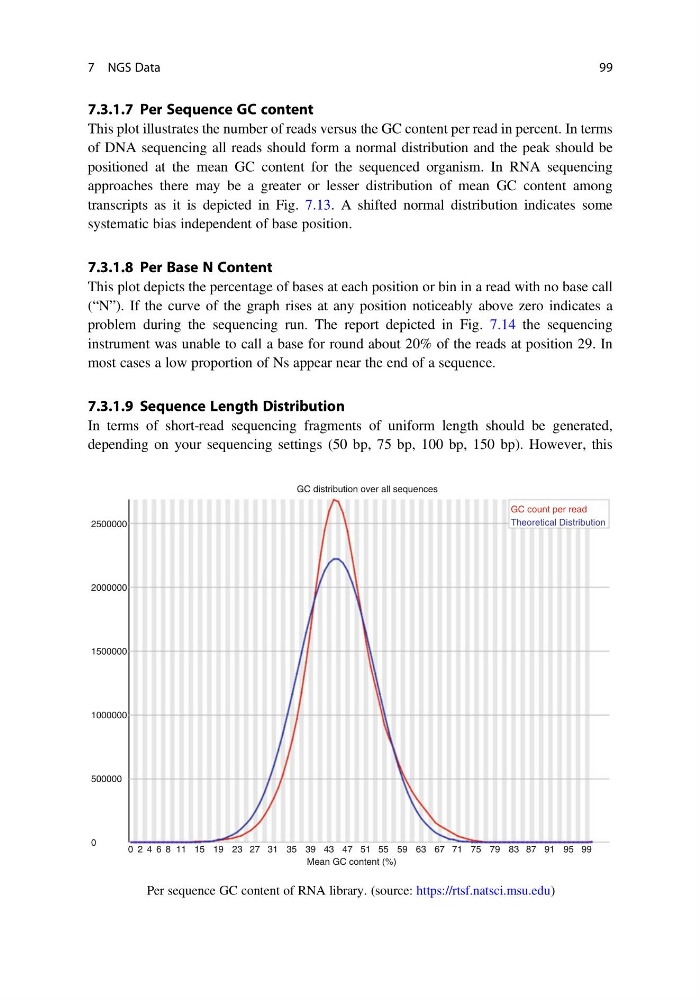
This plot illustrates the number of reads versus the GC content per read in percent. In terms
of DNA sequencing all reads should form a normal distribution and the peak should be
positioned at the mean GC content for the sequenced organism. In RNA sequencing
approaches there may be a greater or lesser distribution of mean GC content among
transcripts as it is depicted in Fig. 7.13. A shifted normal distribution indicates some
systematic bias independent of base position.
7.3.1.8 Per Base N Content
This plot depicts the percentage of bases at each position or bin in a read with no base call
(“N”). If the curve of the graph rises at any position noticeably above zero indicates a
problem during the sequencing run. The report depicted in Fig. 7.14 the sequencing
instrument was unable to call a base for round about 20% of the reads at position 29. In
most cases a low proportion of Ns appear near the end of a sequence.
7.3.1.9 Sequence Length Distribution
In terms of short-read sequencing fragments of uniform length should be generated,
depending on your sequencing settings (50 bp, 75 bp, 100 bp, 150 bp). However, this
2500000
2000000
1500000
1000000
500000
0
0 2 4 6 8 11 15 19 23 27 31 35 39 43 47
Mean GC content (%)
GC distribution over all sequences
GC count per read
Theoretical Distribution
51 55 59 63 67 71 75 79 83 87 91 95 99
Fig. 7.13 Per sequence GC content of RNA library. (source: https://rtsf.natsci.msu.edu)
7 NGS Data
99
This plot illustrates the number of reads versus the GC content per read in percent. In terms
of DNA sequencing all reads should form a normal distribution and the peak should be
positioned at the mean GC content for the sequenced organism. In RNA sequencing
approaches there may be a greater or lesser distribution of mean GC content among
transcripts as it is depicted in Fig. 7.13. A shifted normal distribution indicates some
systematic bias independent of base position.
7.3.1.8 Per Base N Content
This plot depicts the percentage of bases at each position or bin in a read with no base call
(“N”). If the curve of the graph rises at any position noticeably above zero indicates a
problem during the sequencing run. The report depicted in Fig. 7.14 the sequencing
instrument was unable to call a base for round about 20% of the reads at position 29. In
most cases a low proportion of Ns appear near the end of a sequence.
7.3.1.9 Sequence Length Distribution
In terms of short-read sequencing fragments of uniform length should be generated,
depending on your sequencing settings (50 bp, 75 bp, 100 bp, 150 bp). However, this
2500000
2000000
1500000
1000000
500000
0
0 2 4 6 8 11 15 19 23 27 31 35 39 43 47
Mean GC content (%)
GC distribution over all sequences
GC count per read
Theoretical Distribution
51 55 59 63 67 71 75 79 83 87 91 95 99
Fig. 7.13 Per sequence GC content of RNA library. (source: https://rtsf.natsci.msu.edu)
7 NGS Data
99