

and an optical signal will change with time according to Eq. 1 but
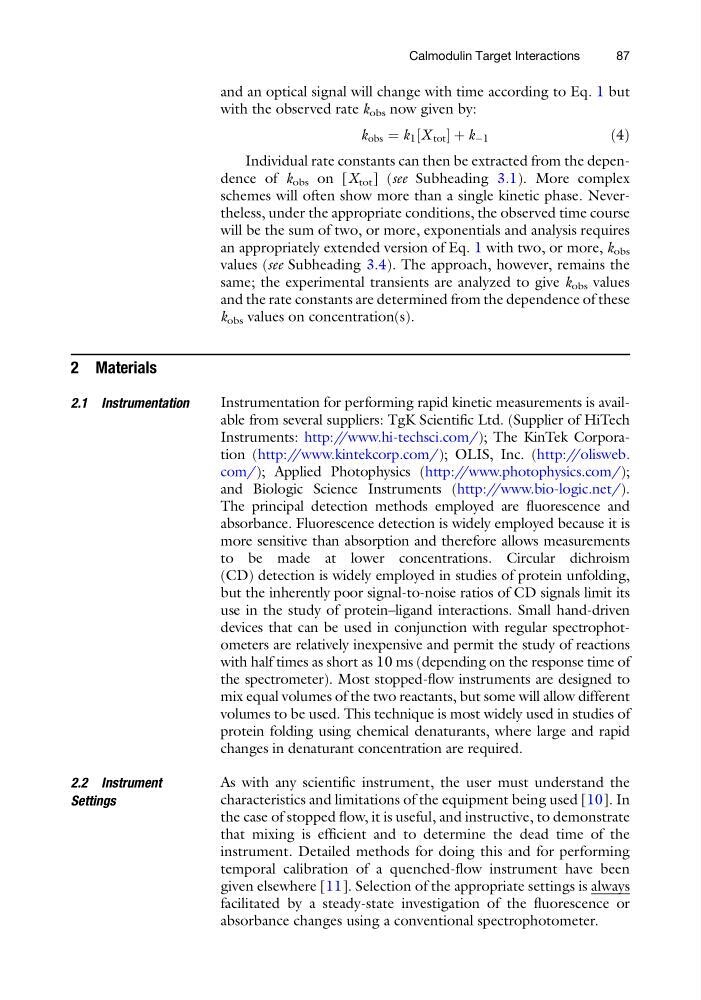
with the observed rate k obs now given by:
k obs ¼ k 1 X tot
½
þk À1
ð4Þ
Individual rate constants can then be extracted from the dependence of k obs on [X tot ] (see Subheading 3.1). More complex
schemes will often show more than a single kinetic phase. Nevertheless, under the appropriate conditions, the observed time course
will be the sum of two, or more, exponentials and analysis requires
an appropriately extended version of Eq. 1 with two, or more, k obs
values (see Subheading 3.4). The approach, however, remains the
same; the experimental transients are analyzed to give k obs values
and the rate constants are determined from the dependence of these
k obs values on concentration(s).
2 Materials
2.1 Instrumentation
Instrumentation for performing rapid kinetic measurements is available from several suppliers: TgK Scientific Ltd. (Supplier of HiTech
Instruments: http://www.hi-techsci.com/); The KinTek Corporation (http://www.kintekcorp.com/); OLIS, Inc. (http://olisweb.
com/); Applied Photophysics (http://www.photophysics.com/);
and Biologic Science Instruments (http://www.bio-logic.net/).
The principal detection methods employed are fluorescence and
absorbance. Fluorescence detection is widely employed because it is
more sensitive than absorption and therefore allows measurements
to be made at lower concentrations. Circular dichroism
(CD) detection is widely employed in studies of protein unfolding,
but the inherently poor signal-to-noise ratios of CD signals limit its
use in the study of protein–ligand interactions. Small hand-driven
devices that can be used in conjunction with regular spectrophotometers are relatively inexpensive and permit the study of reactions
with half times as short as 10 ms (depending on the response time of
the spectrometer). Most stopped-flow instruments are designed to
mix equal volumes of the two reactants, but some will allow different
volumes to be used. This technique is most widely used in studies of
protein folding using chemical denaturants, where large and rapid
changes in denaturant concentration are required.
2.2 Instrument
Settings
As with any scientific instrument, the user must understand the
characteristics and limitations of the equipment being used [10]. In
the case of stopped flow, it is useful, and instructive, to demonstrate
that mixing is efficient and to determine the dead time of the
instrument. Detailed methods for doing this and for performing
temporal calibration of a quenched-flow instrument have been
given elsewhere [11]. Selection of the appropriate settings is always
facilitated by a steady-state investigation of the fluorescence or
absorbance changes using a conventional spectrophotometer.
Calmodulin Target Interactions
87
with the observed rate k obs now given by:
k obs ¼ k 1 X tot
½
þk À1
ð4Þ
Individual rate constants can then be extracted from the dependence of k obs on [X tot ] (see Subheading 3.1). More complex
schemes will often show more than a single kinetic phase. Nevertheless, under the appropriate conditions, the observed time course
will be the sum of two, or more, exponentials and analysis requires
an appropriately extended version of Eq. 1 with two, or more, k obs
values (see Subheading 3.4). The approach, however, remains the
same; the experimental transients are analyzed to give k obs values
and the rate constants are determined from the dependence of these
k obs values on concentration(s).
2 Materials
2.1 Instrumentation
Instrumentation for performing rapid kinetic measurements is available from several suppliers: TgK Scientific Ltd. (Supplier of HiTech
Instruments: http://www.hi-techsci.com/); The KinTek Corporation (http://www.kintekcorp.com/); OLIS, Inc. (http://olisweb.
com/); Applied Photophysics (http://www.photophysics.com/);
and Biologic Science Instruments (http://www.bio-logic.net/).
The principal detection methods employed are fluorescence and
absorbance. Fluorescence detection is widely employed because it is
more sensitive than absorption and therefore allows measurements
to be made at lower concentrations. Circular dichroism
(CD) detection is widely employed in studies of protein unfolding,
but the inherently poor signal-to-noise ratios of CD signals limit its
use in the study of protein–ligand interactions. Small hand-driven
devices that can be used in conjunction with regular spectrophotometers are relatively inexpensive and permit the study of reactions
with half times as short as 10 ms (depending on the response time of
the spectrometer). Most stopped-flow instruments are designed to
mix equal volumes of the two reactants, but some will allow different
volumes to be used. This technique is most widely used in studies of
protein folding using chemical denaturants, where large and rapid
changes in denaturant concentration are required.
2.2 Instrument
Settings
As with any scientific instrument, the user must understand the
characteristics and limitations of the equipment being used [10]. In
the case of stopped flow, it is useful, and instructive, to demonstrate
that mixing is efficient and to determine the dead time of the
instrument. Detailed methods for doing this and for performing
temporal calibration of a quenched-flow instrument have been
given elsewhere [11]. Selection of the appropriate settings is always
facilitated by a steady-state investigation of the fluorescence or
absorbance changes using a conventional spectrophotometer.
Calmodulin Target Interactions
87