

volumes. Time points between ~5 ms and ~150 ms can usually be
obtained in this way. Quenched-flow methods have the advantage
that they can be used when no optical signal is available [8], but are
much more labor intensive than stopped-flow methods.
In continuous flow, the reactants are mixed and an optical
signal is monitored at different positions downstream from the
mixer and converted into a time-dependent signal change on the
basis of the known flow rate. Continuous flow has the potential to
measure reactions on a much faster time scale than stopped-flow
[9], but stopped-flow is generally preferred because of its better
sample economy and its ability to measure the kinetics out to longer
times.
In this study, we chose fluorescence stopped-flow to investigate
the interactions in question, as it was the most convenient, covered
the relevant time scales and suitable fluorescent probes were
available.
1.3 Reaction Kinetics
and Thermodynamics
Throughout this chapter, we use the symbols P and L to indicate
“protein” and “ligand”—as many intracellular interactions are
between proteins and small molecules—but these may be any two
reactants, proteins, nucleic acids, lipids, biomolecular assemblies,
etc. PL is used to indicate a complex between P and L, and P*, L*,
and PL* indicate different conformational states of these species.
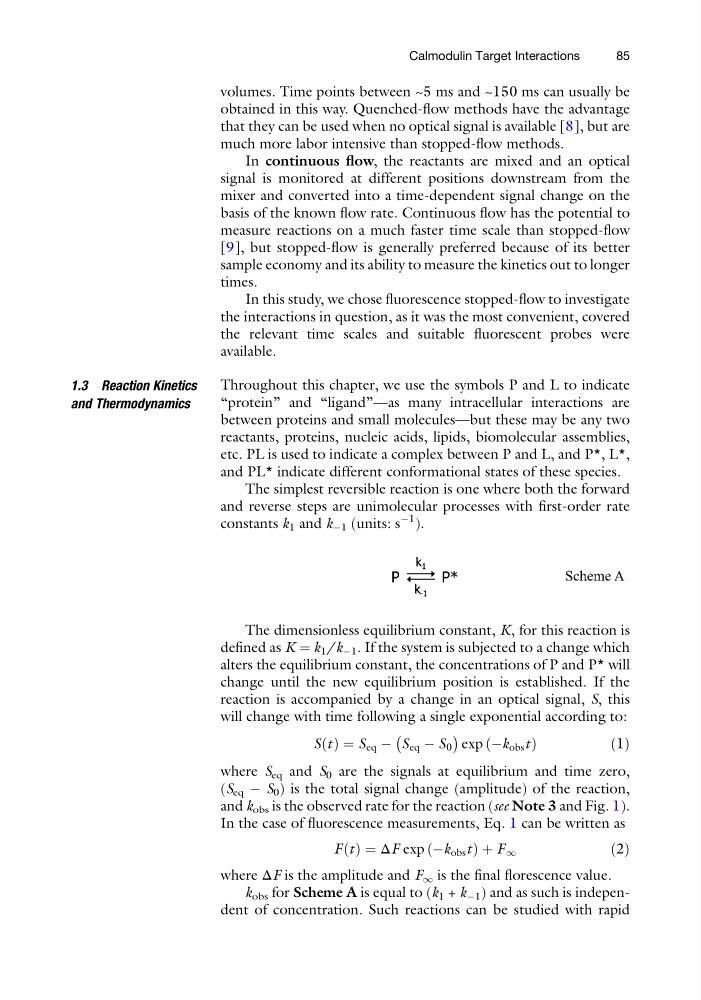
The simplest reversible reaction is one where both the forward
and reverse steps are unimolecular processes with first-order rate
constants k 1 and k À1 (units: s
À1 ).
The dimensionless equilibrium constant, K, for this reaction is
defined as K ¼ k 1 /k À1 . If the system is subjected to a change which
alters the equilibrium constant, the concentrations of P and P* will
change until the new equilibrium position is established. If the
reaction is accompanied by a change in an optical signal, S, this
will change with time following a single exponential according to:
S t
ð Þ ¼ S eq À S eq À S 0
À
Á
exp Àk obs t
ð
Þ
ð1Þ
where S eq and S 0 are the signals at equilibrium and time zero,
(S eq À S 0 ) is the total signal change (amplitude) of the reaction,
and k obs is the observed rate for the reaction (see Note 3 and Fig. 1).
In the case of fluorescence measurements, Eq. 1 can be written as
F t
ð Þ ¼ ΔF exp Àk obs t
ð
ÞþF 1
ð2Þ
where ΔF is the amplitude and F 1 is the final florescence value.
k obs for Scheme A is equal to (k 1 + k À1 ) and as such is independent of concentration. Such reactions can be studied with rapid
Calmodulin Target Interactions
85
obtained in this way. Quenched-flow methods have the advantage
that they can be used when no optical signal is available [8], but are
much more labor intensive than stopped-flow methods.
In continuous flow, the reactants are mixed and an optical
signal is monitored at different positions downstream from the
mixer and converted into a time-dependent signal change on the
basis of the known flow rate. Continuous flow has the potential to
measure reactions on a much faster time scale than stopped-flow
[9], but stopped-flow is generally preferred because of its better
sample economy and its ability to measure the kinetics out to longer
times.
In this study, we chose fluorescence stopped-flow to investigate
the interactions in question, as it was the most convenient, covered
the relevant time scales and suitable fluorescent probes were
available.
1.3 Reaction Kinetics
and Thermodynamics
Throughout this chapter, we use the symbols P and L to indicate
“protein” and “ligand”—as many intracellular interactions are
between proteins and small molecules—but these may be any two
reactants, proteins, nucleic acids, lipids, biomolecular assemblies,
etc. PL is used to indicate a complex between P and L, and P*, L*,
and PL* indicate different conformational states of these species.
The simplest reversible reaction is one where both the forward
and reverse steps are unimolecular processes with first-order rate
constants k 1 and k À1 (units: s
À1 ).
The dimensionless equilibrium constant, K, for this reaction is
defined as K ¼ k 1 /k À1 . If the system is subjected to a change which
alters the equilibrium constant, the concentrations of P and P* will
change until the new equilibrium position is established. If the
reaction is accompanied by a change in an optical signal, S, this
will change with time following a single exponential according to:
S t
ð Þ ¼ S eq À S eq À S 0
À
Á
exp Àk obs t
ð
Þ
ð1Þ
where S eq and S 0 are the signals at equilibrium and time zero,
(S eq À S 0 ) is the total signal change (amplitude) of the reaction,
and k obs is the observed rate for the reaction (see Note 3 and Fig. 1).
In the case of fluorescence measurements, Eq. 1 can be written as
F t
ð Þ ¼ ΔF exp Àk obs t
ð
ÞþF 1
ð2Þ
where ΔF is the amplitude and F 1 is the final florescence value.
k obs for Scheme A is equal to (k 1 + k À1 ) and as such is independent of concentration. Such reactions can be studied with rapid
Calmodulin Target Interactions
85