

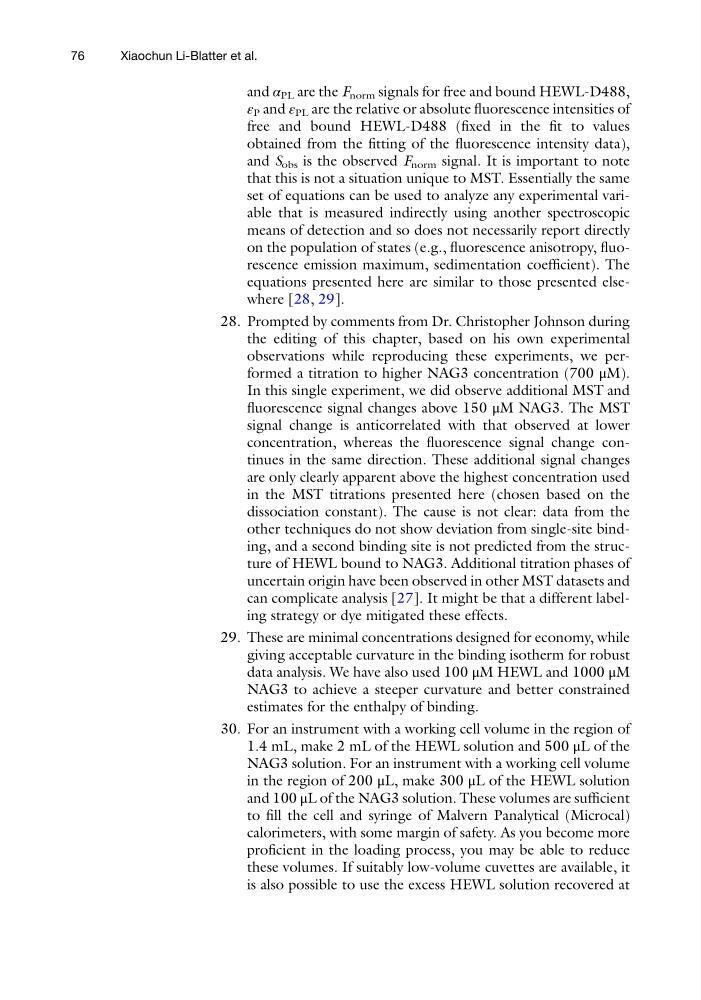
and α PL are the F norm signals for free and bound HEWL-D488,
ε P and ε PL are the relative or absolute fluorescence intensities of
free and bound HEWL-D488 (fixed in the fit to values
obtained from the fitting of the fluorescence intensity data),
and S obs is the observed F norm signal. It is important to note
that this is not a situation unique to MST. Essentially the same
set of equations can be used to analyze any experimental variable that is measured indirectly using another spectroscopic
means of detection and so does not necessarily report directly
on the population of states (e.g., fluorescence anisotropy, fluorescence emission maximum, sedimentation coefficient). The
equations presented here are similar to those presented elsewhere [28, 29].
28. Prompted by comments from Dr. Christopher Johnson during
the editing of this chapter, based on his own experimental
observations while reproducing these experiments, we performed a titration to higher NAG3 concentration (700 μM).
In this single experiment, we did observe additional MST and
fluorescence signal changes above 150 μM NAG3. The MST
signal change is anticorrelated with that observed at lower
concentration, whereas the fluorescence signal change continues in the same direction. These additional signal changes
are only clearly apparent above the highest concentration used
in the MST titrations presented here (chosen based on the
dissociation constant). The cause is not clear: data from the
other techniques do not show deviation from single-site binding, and a second binding site is not predicted from the structure of HEWL bound to NAG3. Additional titration phases of
uncertain origin have been observed in other MST datasets and
can complicate analysis [27]. It might be that a different labeling strategy or dye mitigated these effects.
29. These are minimal concentrations designed for economy, while
giving acceptable curvature in the binding isotherm for robust
data analysis. We have also used 100 μM HEWL and 1000 μM
NAG3 to achieve a steeper curvature and better constrained
estimates for the enthalpy of binding.
30. For an instrument with a working cell volume in the region of
1.4 mL, make 2 mL of the HEWL solution and 500 μL of the
NAG3 solution. For an instrument with a working cell volume
in the region of 200 μL, make 300 μL of the HEWL solution
and 100 μL of the NAG3 solution. These volumes are sufficient
to fill the cell and syringe of Malvern Panalytical (Microcal)
calorimeters, with some margin of safety. As you become more
proficient in the loading process, you may be able to reduce
these volumes. If suitably low-volume cuvettes are available, it
is also possible to use the excess HEWL solution recovered at
76
Xiaochun Li-Blatter et al.
ε P and ε PL are the relative or absolute fluorescence intensities of
free and bound HEWL-D488 (fixed in the fit to values
obtained from the fitting of the fluorescence intensity data),
and S obs is the observed F norm signal. It is important to note
that this is not a situation unique to MST. Essentially the same
set of equations can be used to analyze any experimental variable that is measured indirectly using another spectroscopic
means of detection and so does not necessarily report directly
on the population of states (e.g., fluorescence anisotropy, fluorescence emission maximum, sedimentation coefficient). The
equations presented here are similar to those presented elsewhere [28, 29].
28. Prompted by comments from Dr. Christopher Johnson during
the editing of this chapter, based on his own experimental
observations while reproducing these experiments, we performed a titration to higher NAG3 concentration (700 μM).
In this single experiment, we did observe additional MST and
fluorescence signal changes above 150 μM NAG3. The MST
signal change is anticorrelated with that observed at lower
concentration, whereas the fluorescence signal change continues in the same direction. These additional signal changes
are only clearly apparent above the highest concentration used
in the MST titrations presented here (chosen based on the
dissociation constant). The cause is not clear: data from the
other techniques do not show deviation from single-site binding, and a second binding site is not predicted from the structure of HEWL bound to NAG3. Additional titration phases of
uncertain origin have been observed in other MST datasets and
can complicate analysis [27]. It might be that a different labeling strategy or dye mitigated these effects.
29. These are minimal concentrations designed for economy, while
giving acceptable curvature in the binding isotherm for robust
data analysis. We have also used 100 μM HEWL and 1000 μM
NAG3 to achieve a steeper curvature and better constrained
estimates for the enthalpy of binding.
30. For an instrument with a working cell volume in the region of
1.4 mL, make 2 mL of the HEWL solution and 500 μL of the
NAG3 solution. For an instrument with a working cell volume
in the region of 200 μL, make 300 μL of the HEWL solution
and 100 μL of the NAG3 solution. These volumes are sufficient
to fill the cell and syringe of Malvern Panalytical (Microcal)
calorimeters, with some margin of safety. As you become more
proficient in the loading process, you may be able to reduce
these volumes. If suitably low-volume cuvettes are available, it
is also possible to use the excess HEWL solution recovered at
76
Xiaochun Li-Blatter et al.