

24. The cheaper “standard” MST capillaries give data with little
scatter and minimal adhesion in the presence of Tween 20; in
the absence of Tween 20, other capillaries should be used.
25. This experiment was developed on a rather old Nanotemper
Monolith instrument, lacking the latest software due to incompatibility. Therefore, it might be necessary to make some small
alterations to the protocol to suit newer instruments and
software.
26. Here F norm was calculated from the mean fluorescence signals
at 2.5 and 30 s to give the best signal-to-noise. As noted in the
excellent paper by Brautigam and colleagues [27], the
observed K d may vary as a function of heating time due to
kinetic relaxation of the system at the higher temperature
achieved through heating. We observed no significant difference in fitted K d for any of the datasets when F norm was
calculated for “thermophoresis plus jump” phases with the
endpoint at 30, 20, or 10 s (a global fit of data from the three
heating times to a shared K d was statistically indistinguishable
from fits to local K d values at the 95% confidence level according to an F-test performed in Graphpad Prism 7).
27. Thermophoresis is monitored via changes in fluorescence
intensity in a detection volume due to depletion or enrichment
of macromolecules during heating. For a mixture of free and
bound macromolecule with equal fluorescence intensity, the
thermophoresis signal is an average of the F norm signals of the
free and bound species, weighted by their mole fraction
(Eq. 1). When the fluorescence intensity of the two species
are different, the thermophoresis signal is an average of the
F norm signals of the free and bound species, weighted by their
mole fraction of the total fluorescence intensity; i.e., even for
equal populations of free and NAG3-bound HEWL-D488
(equal mole fractions), the NAG3-bound form would contribute significantly more to the observed thermophoresis signal
since it has a significantly higher fluorescence intensity (a factor
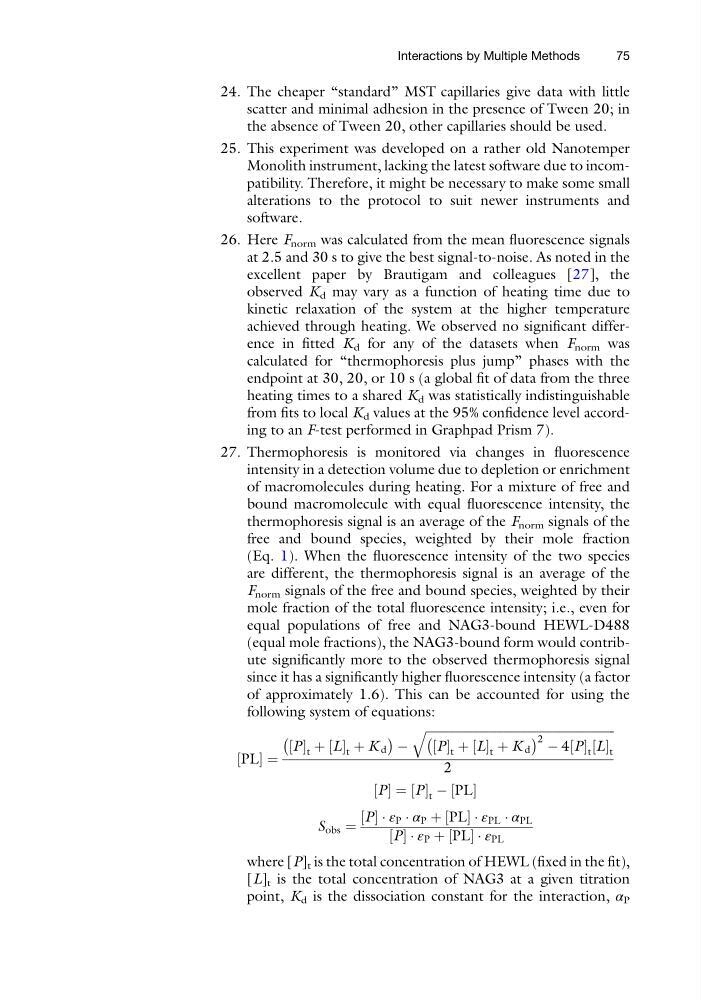
of approximately 1.6). This can be accounted for using the
following system of equations:
PL
½ ¼
P
½ t þ L
½ t þ K d
À
Á À
ffiffiffiffiffiffiffiffiffiffiffiffiffiffiffiffiffiffiffiffiffiffiffiffiffiffiffiffiffiffiffiffiffiffiffiffiffiffiffiffiffiffiffiffiffiffiffiffiffiffiffiffiffiffiffiffiffiffiffiffiffiffi ffi
P
½ t þ L
½ t þ K d
À
Á 2 À 4 P
½ t L
½ t
q
2
P
½ ¼ P
½ t À PL
½
S obs ¼
P
½ Á ε P Á α P þ PL
½ Á ε PL Á α PL
P
½ Á ε P þ PL
½ Á ε PL
where [P] t is the total concentration of HEWL (fixed in the fit),
[L] t is the total concentration of NAG3 at a given titration
point, K d is the dissociation constant for the interaction, α P
Interactions by Multiple Methods
75
scatter and minimal adhesion in the presence of Tween 20; in
the absence of Tween 20, other capillaries should be used.
25. This experiment was developed on a rather old Nanotemper
Monolith instrument, lacking the latest software due to incompatibility. Therefore, it might be necessary to make some small
alterations to the protocol to suit newer instruments and
software.
26. Here F norm was calculated from the mean fluorescence signals
at 2.5 and 30 s to give the best signal-to-noise. As noted in the
excellent paper by Brautigam and colleagues [27], the
observed K d may vary as a function of heating time due to
kinetic relaxation of the system at the higher temperature
achieved through heating. We observed no significant difference in fitted K d for any of the datasets when F norm was
calculated for “thermophoresis plus jump” phases with the
endpoint at 30, 20, or 10 s (a global fit of data from the three
heating times to a shared K d was statistically indistinguishable
from fits to local K d values at the 95% confidence level according to an F-test performed in Graphpad Prism 7).
27. Thermophoresis is monitored via changes in fluorescence
intensity in a detection volume due to depletion or enrichment
of macromolecules during heating. For a mixture of free and
bound macromolecule with equal fluorescence intensity, the
thermophoresis signal is an average of the F norm signals of the
free and bound species, weighted by their mole fraction
(Eq. 1). When the fluorescence intensity of the two species
are different, the thermophoresis signal is an average of the
F norm signals of the free and bound species, weighted by their
mole fraction of the total fluorescence intensity; i.e., even for
equal populations of free and NAG3-bound HEWL-D488
(equal mole fractions), the NAG3-bound form would contribute significantly more to the observed thermophoresis signal
since it has a significantly higher fluorescence intensity (a factor
of approximately 1.6). This can be accounted for using the
following system of equations:
PL
½ ¼
P
½ t þ L
½ t þ K d
À
Á À
ffiffiffiffiffiffiffiffiffiffiffiffiffiffiffiffiffiffiffiffiffiffiffiffiffiffiffiffiffiffiffiffiffiffiffiffiffiffiffiffiffiffiffiffiffiffiffiffiffiffiffiffiffiffiffiffiffiffiffiffiffiffi ffi
P
½ t þ L
½ t þ K d
À
Á 2 À 4 P
½ t L
½ t
q
2
P
½ ¼ P
½ t À PL
½
S obs ¼
P
½ Á ε P Á α P þ PL
½ Á ε PL Á α PL
P
½ Á ε P þ PL
½ Á ε PL
where [P] t is the total concentration of HEWL (fixed in the fit),
[L] t is the total concentration of NAG3 at a given titration
point, K d is the dissociation constant for the interaction, α P
Interactions by Multiple Methods
75