

2. Fit the response isotherm to a 1:1 binding model in the BiaEvaluation software or to Eq. 2 in other software capable of
nonlinear regression.
R eq ¼
R max L
½
K d þ L
½
þ R 0
ð2Þ
where R eq is the response from the sensor chip (the y-axis
variable), [L] is the concentration of NAG3 in flow at a particular injection, R 0 is the response baseline before an injection,
R max is the asymptotic response at infinite NAG3 concentration, and K d is the dissociation constant for the interaction.
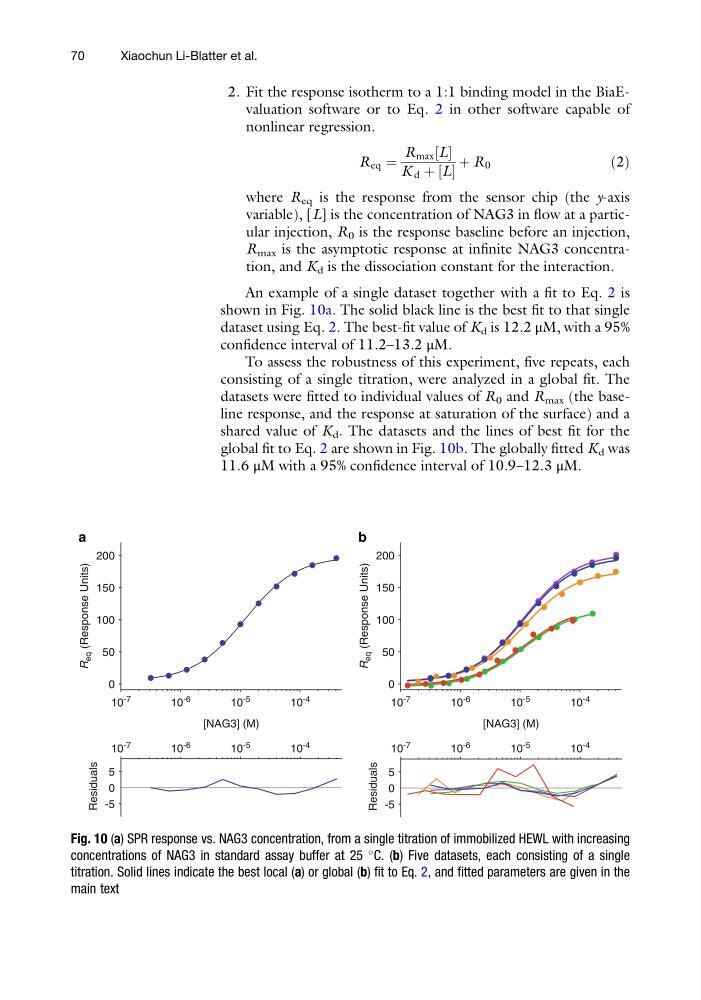
An example of a single dataset together with a fit to Eq. 2 is
shown in Fig. 10a. The solid black line is the best fit to that single
dataset using Eq. 2. The best-fit value of K d is 12.2 μM, with a 95%
confidence interval of 11.2–13.2 μM.
To assess the robustness of this experiment, five repeats, each
consisting of a single titration, were analyzed in a global fit. The
datasets were fitted to individual values of R 0 and R max (the baseline response, and the response at saturation of the surface) and a
shared value of K d . The datasets and the lines of best fit for the
global fit to Eq. 2 are shown in Fig. 10b. The globally fitted K d was
11.6 μM with a 95% confidence interval of 10.9–12.3 μM.
0
50
100
150
200
[NAG3] (M)
10
-7
10
-6
10
-5
10
-4
10
-7
10
-6
10
-5
10
-4
10
-7
10
-6
10
-5
10
-4
10
-7
10
-6
10
-5
10
-4
-5
0
5
Residuals
0
50
100
150
200
[NAG3] (M)
R
eq (Response Units)
R
eq (Response Units)
-5
0
5
Residuals
a
b
Fig. 10 (a) SPR response vs. NAG3 concentration, from a single titration of immobilized HEWL with increasing
concentrations of NAG3 in standard assay buffer at 25
C. (b) Five datasets, each consisting of a single
titration. Solid lines indicate the best local (a) or global (b) fit to Eq. 2, and fitted parameters are given in the
main text
70
Xiaochun Li-Blatter et al.
nonlinear regression.
R eq ¼
R max L
½
K d þ L
½
þ R 0
ð2Þ
where R eq is the response from the sensor chip (the y-axis
variable), [L] is the concentration of NAG3 in flow at a particular injection, R 0 is the response baseline before an injection,
R max is the asymptotic response at infinite NAG3 concentration, and K d is the dissociation constant for the interaction.
An example of a single dataset together with a fit to Eq. 2 is
shown in Fig. 10a. The solid black line is the best fit to that single
dataset using Eq. 2. The best-fit value of K d is 12.2 μM, with a 95%
confidence interval of 11.2–13.2 μM.
To assess the robustness of this experiment, five repeats, each
consisting of a single titration, were analyzed in a global fit. The
datasets were fitted to individual values of R 0 and R max (the baseline response, and the response at saturation of the surface) and a
shared value of K d . The datasets and the lines of best fit for the
global fit to Eq. 2 are shown in Fig. 10b. The globally fitted K d was
11.6 μM with a 95% confidence interval of 10.9–12.3 μM.
0
50
100
150
200
[NAG3] (M)
10
-7
10
-6
10
-5
10
-4
10
-7
10
-6
10
-5
10
-4
10
-7
10
-6
10
-5
10
-4
10
-7
10
-6
10
-5
10
-4
-5
0
5
Residuals
0
50
100
150
200
[NAG3] (M)
R
eq (Response Units)
R
eq (Response Units)
-5
0
5
Residuals
a
b
Fig. 10 (a) SPR response vs. NAG3 concentration, from a single titration of immobilized HEWL with increasing
concentrations of NAG3 in standard assay buffer at 25
C. (b) Five datasets, each consisting of a single
titration. Solid lines indicate the best local (a) or global (b) fit to Eq. 2, and fitted parameters are given in the
main text
70
Xiaochun Li-Blatter et al.