

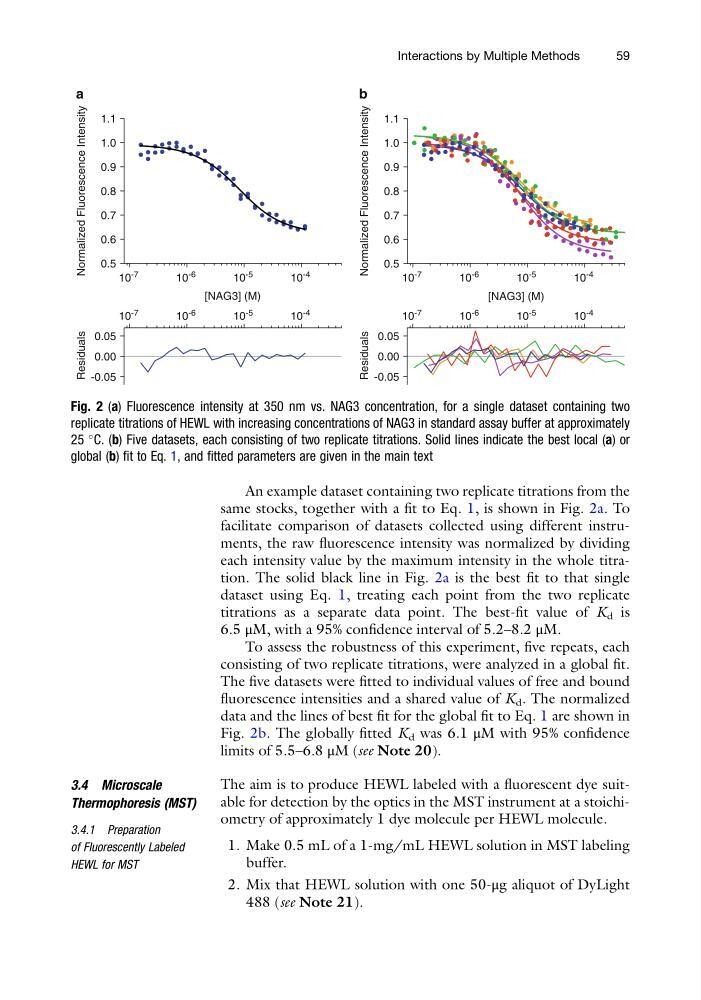
An example dataset containing two replicate titrations from the
same stocks, together with a fit to Eq. 1, is shown in Fig. 2a. To
facilitate comparison of datasets collected using different instruments, the raw fluorescence intensity was normalized by dividing
each intensity value by the maximum intensity in the whole titration. The solid black line in Fig. 2a is the best fit to that single
dataset using Eq. 1, treating each point from the two replicate
titrations as a separate data point. The best-fit value of K d is
6.5 μM, with a 95% confidence interval of 5.2–8.2 μM.
To assess the robustness of this experiment, five repeats, each
consisting of two replicate titrations, were analyzed in a global fit.
The five datasets were fitted to individual values of free and bound
fluorescence intensities and a shared value of K d . The normalized
data and the lines of best fit for the global fit to Eq. 1 are shown in
Fig. 2b. The globally fitted K d was 6.1 μM with 95% confidence
limits of 5.5–6.8 μM (see Note 20).
3.4 Microscale
Thermophoresis (MST)
3.4.1 Preparation
of Fluorescently Labeled
HEWL for MST
The aim is to produce HEWL labeled with a fluorescent dye suitable for detection by the optics in the MST instrument at a stoichiometry of approximately 1 dye molecule per HEWL molecule.
1. Make 0.5 mL of a 1-mg/mL HEWL solution in MST labeling
buffer.
2. Mix that HEWL solution with one 50-μg aliquot of DyLight
488 (see Note 21).
0.5
0.6
0.7
0.8
0.9
1.0
1.1
[NAG3] (M)
Normalized Fluorescence Intensity
10
-7
10
-6
10
-5
10
-4
10
-7
10
-6
10
-5
10
-4
10
-7
10
-6
10
-5
10
-4
10
-7
10
-6
10
-5
10
-4
-0.05
0.00
0.05
Residuals
0.5
0.6
0.7
0.8
0.9
1.0
1.1
[NAG3] (M)
Normalized Fluorescence Intensity
-0.05
0.00
0.05
Residuals
a
b
Fig. 2 (a) Fluorescence intensity at 350 nm vs. NAG3 concentration, for a single dataset containing two
replicate titrations of HEWL with increasing concentrations of NAG3 in standard assay buffer at approximately
25
C. (b) Five datasets, each consisting of two replicate titrations. Solid lines indicate the best local (a) or
global (b) fit to Eq. 1, and fitted parameters are given in the main text
Interactions by Multiple Methods
59
same stocks, together with a fit to Eq. 1, is shown in Fig. 2a. To
facilitate comparison of datasets collected using different instruments, the raw fluorescence intensity was normalized by dividing
each intensity value by the maximum intensity in the whole titration. The solid black line in Fig. 2a is the best fit to that single
dataset using Eq. 1, treating each point from the two replicate
titrations as a separate data point. The best-fit value of K d is
6.5 μM, with a 95% confidence interval of 5.2–8.2 μM.
To assess the robustness of this experiment, five repeats, each
consisting of two replicate titrations, were analyzed in a global fit.
The five datasets were fitted to individual values of free and bound
fluorescence intensities and a shared value of K d . The normalized
data and the lines of best fit for the global fit to Eq. 1 are shown in
Fig. 2b. The globally fitted K d was 6.1 μM with 95% confidence
limits of 5.5–6.8 μM (see Note 20).
3.4 Microscale
Thermophoresis (MST)
3.4.1 Preparation
of Fluorescently Labeled
HEWL for MST
The aim is to produce HEWL labeled with a fluorescent dye suitable for detection by the optics in the MST instrument at a stoichiometry of approximately 1 dye molecule per HEWL molecule.
1. Make 0.5 mL of a 1-mg/mL HEWL solution in MST labeling
buffer.
2. Mix that HEWL solution with one 50-μg aliquot of DyLight
488 (see Note 21).
0.5
0.6
0.7
0.8
0.9
1.0
1.1
[NAG3] (M)
Normalized Fluorescence Intensity
10
-7
10
-6
10
-5
10
-4
10
-7
10
-6
10
-5
10
-4
10
-7
10
-6
10
-5
10
-4
10
-7
10
-6
10
-5
10
-4
-0.05
0.00
0.05
Residuals
0.5
0.6
0.7
0.8
0.9
1.0
1.1
[NAG3] (M)
Normalized Fluorescence Intensity
-0.05
0.00
0.05
Residuals
a
b
Fig. 2 (a) Fluorescence intensity at 350 nm vs. NAG3 concentration, for a single dataset containing two
replicate titrations of HEWL with increasing concentrations of NAG3 in standard assay buffer at approximately
25
C. (b) Five datasets, each consisting of two replicate titrations. Solid lines indicate the best local (a) or
global (b) fit to Eq. 1, and fitted parameters are given in the main text
Interactions by Multiple Methods
59