

2. Place the microplate into the plate reader and measure fluorescence intensity at 25
C, or as close to that temperature as the
ambient conditions in the plate reader will allow.
3. Fluorescence should be excited at 290 nm and emission should
be measured at 350 nm, with the narrowest bandwidth available in the plate reader used (typically somewhere between
2 and 20 nm) (see Note 18).
4. The gain for the fluorescence detector should be set by scanning all wells in the titration and setting the gain such that the
well with the highest fluorescence intensity has a measured
value below the saturating value for the detector. Most plate
readers can perform this adjustment automatically. The well
with the lowest concentration of NAG3 should have the highest fluorescence intensity.
5. Some plate readers can also perform an automatic z-height
adjustment for optimal signal intensity. If possible, this should
be performed on the same well.
3.3.3 Fluorescence
Intensity Data Analysis
and Typical Results
The aim is to analyze the fluorescence intensity titration to obtain a
value of K d for the interaction between HEWL and NAG3.
1. Plot the fluorescence intensity against the molar concentration
of NAG3. It is easier to visualize the scatter of the data and the
quality of fits to the data if they are plotted on a logarithmic xaxis.
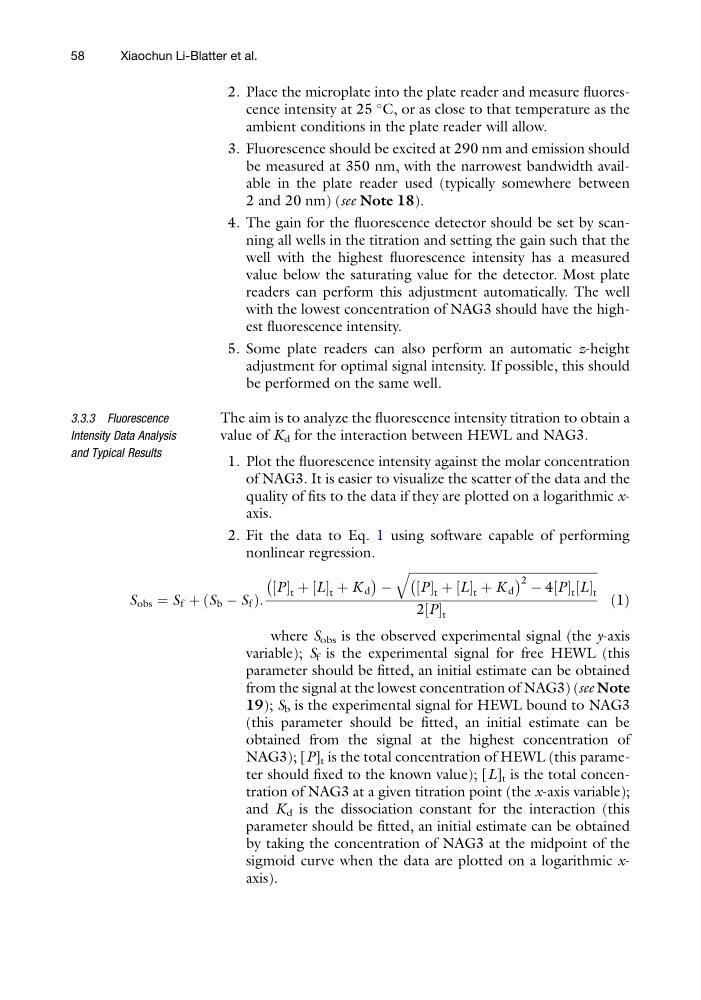
2. Fit the data to Eq. 1 using software capable of performing
nonlinear regression.
S obs ¼ S f þ S b À S f
ð
Þ:
P
½ t þ L
½ t þ K d
À
Á À
ffiffiffiffiffiffiffiffiffiffiffiffiffiffiffiffiffiffiffiffiffiffiffiffiffiffiffiffiffiffiffiffiffiffiffiffiffiffiffiffiffiffiffiffiffiffiffiffiffiffiffiffiffiffiffiffiffiffiffiffiffiffi ffi
P
½ t þ L
½ t þ K d
À
Á 2 À 4 P
½ t L
½ t
q
2 P
½ t
ð1Þ
where S obs is the observed experimental signal (the y-axis
variable); S f is the experimental signal for free HEWL (this
parameter should be fitted, an initial estimate can be obtained
from the signal at the lowest concentration of NAG3) (see Note
19); S b is the experimental signal for HEWL bound to NAG3
(this parameter should be fitted, an initial estimate can be
obtained from the signal at the highest concentration of
NAG3); [P] t is the total concentration of HEWL (this parameter should fixed to the known value); [L] t is the total concentration of NAG3 at a given titration point (the x-axis variable);
and K d is the dissociation constant for the interaction (this
parameter should be fitted, an initial estimate can be obtained
by taking the concentration of NAG3 at the midpoint of the
sigmoid curve when the data are plotted on a logarithmic xaxis).
58
Xiaochun Li-Blatter et al.
C, or as close to that temperature as the
ambient conditions in the plate reader will allow.
3. Fluorescence should be excited at 290 nm and emission should
be measured at 350 nm, with the narrowest bandwidth available in the plate reader used (typically somewhere between
2 and 20 nm) (see Note 18).
4. The gain for the fluorescence detector should be set by scanning all wells in the titration and setting the gain such that the
well with the highest fluorescence intensity has a measured
value below the saturating value for the detector. Most plate
readers can perform this adjustment automatically. The well
with the lowest concentration of NAG3 should have the highest fluorescence intensity.
5. Some plate readers can also perform an automatic z-height
adjustment for optimal signal intensity. If possible, this should
be performed on the same well.
3.3.3 Fluorescence
Intensity Data Analysis
and Typical Results
The aim is to analyze the fluorescence intensity titration to obtain a
value of K d for the interaction between HEWL and NAG3.
1. Plot the fluorescence intensity against the molar concentration
of NAG3. It is easier to visualize the scatter of the data and the
quality of fits to the data if they are plotted on a logarithmic xaxis.
2. Fit the data to Eq. 1 using software capable of performing
nonlinear regression.
S obs ¼ S f þ S b À S f
ð
Þ:
P
½ t þ L
½ t þ K d
À
Á À
ffiffiffiffiffiffiffiffiffiffiffiffiffiffiffiffiffiffiffiffiffiffiffiffiffiffiffiffiffiffiffiffiffiffiffiffiffiffiffiffiffiffiffiffiffiffiffiffiffiffiffiffiffiffiffiffiffiffiffiffiffiffi ffi
P
½ t þ L
½ t þ K d
À
Á 2 À 4 P
½ t L
½ t
q
2 P
½ t
ð1Þ
where S obs is the observed experimental signal (the y-axis
variable); S f is the experimental signal for free HEWL (this
parameter should be fitted, an initial estimate can be obtained
from the signal at the lowest concentration of NAG3) (see Note
19); S b is the experimental signal for HEWL bound to NAG3
(this parameter should be fitted, an initial estimate can be
obtained from the signal at the highest concentration of
NAG3); [P] t is the total concentration of HEWL (this parameter should fixed to the known value); [L] t is the total concentration of NAG3 at a given titration point (the x-axis variable);
and K d is the dissociation constant for the interaction (this
parameter should be fitted, an initial estimate can be obtained
by taking the concentration of NAG3 at the midpoint of the
sigmoid curve when the data are plotted on a logarithmic xaxis).
58
Xiaochun Li-Blatter et al.