

0
2
4
6
8
Retention (min)
Flow (μL / min)
0
50
100
0
25
50
0
5
10
15
20
Retention (min)
% B
0
50
100
0
25
50
Time (min)
Intens
y
t
i
Total Ion Chromatogram (TIC)
a
b
Short Blank Method
MS Method
Long MS/MS Method
Retention (min)
0
5
10
15
20
Retention (min)
Short MS/MS Method
0
2 0
4 0
6 0
0
50
100
0
25
50
0
50
100
0
25
50
%B
Flow (uL/min)
PH
KD
Soluble Akt
(Apo)
KD
ATP
PH
Akt +
Membrane
Membrane
with 5% PIP3
Non-Deuterated
Membrane Bound
Peptide 1
Peptide 2
0.0
2.5
5.0
7.5
10.0
12.5
15.0
17.5
20.0
Apo
Increasing HDX Time
Increasing HDX Time
1
10
100 1000
0
10
20
30
40
Relative Deuteron
Exchange
Apo
+ Mem
Peptide 1
0.3s
0.3s
0.3s
3s
3s
3s
30s
30s
30s
0.3s
0.3s
0.3s
3s
3s
3s
30s
30s
30s
1
10
100 1000
0
20
40
60
80
Time (s)
Relative Deuteron
Exchange
Peptide 2
c
d
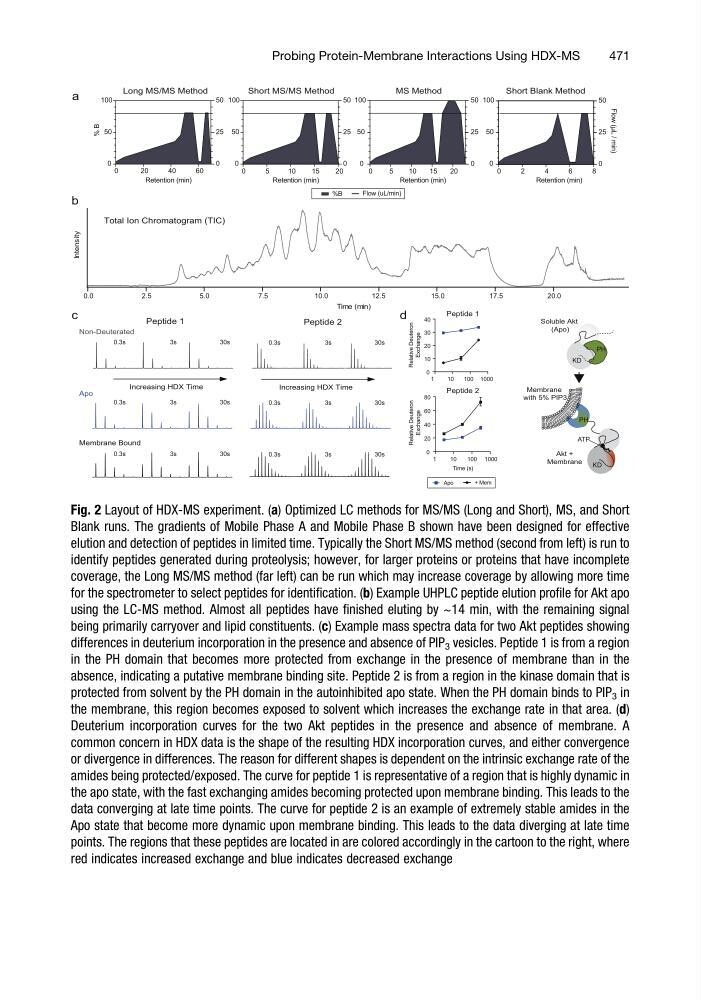
Fig. 2 Layout of HDX-MS experiment. (a) Optimized LC methods for MS/MS (Long and Short), MS, and Short
Blank runs. The gradients of Mobile Phase A and Mobile Phase B shown have been designed for effective
elution and detection of peptides in limited time. Typically the Short MS/MS method (second from left) is run to
identify peptides generated during proteolysis; however, for larger proteins or proteins that have incomplete
coverage, the Long MS/MS method (far left) can be run which may increase coverage by allowing more time
for the spectrometer to select peptides for identification. (b) Example UHPLC peptide elution profile for Akt apo
using the LC-MS method. Almost all peptides have finished eluting by ~14 min, with the remaining signal
being primarily carryover and lipid constituents. (c) Example mass spectra data for two Akt peptides showing
differences in deuterium incorporation in the presence and absence of PIP 3 vesicles. Peptide 1 is from a region
in the PH domain that becomes more protected from exchange in the presence of membrane than in the
absence, indicating a putative membrane binding site. Peptide 2 is from a region in the kinase domain that is
protected from solvent by the PH domain in the autoinhibited apo state. When the PH domain binds to PIP 3 in
the membrane, this region becomes exposed to solvent which increases the exchange rate in that area. (d)
Deuterium incorporation curves for the two Akt peptides in the presence and absence of membrane. A
common concern in HDX data is the shape of the resulting HDX incorporation curves, and either convergence
or divergence in differences. The reason for different shapes is dependent on the intrinsic exchange rate of the
amides being protected/exposed. The curve for peptide 1 is representative of a region that is highly dynamic in
the apo state, with the fast exchanging amides becoming protected upon membrane binding. This leads to the
data converging at late time points. The curve for peptide 2 is an example of extremely stable amides in the
Apo state that become more dynamic upon membrane binding. This leads to the data diverging at late time
points. The regions that these peptides are located in are colored accordingly in the cartoon to the right, where
red indicates increased exchange and blue indicates decreased exchange
Probing Protein-Membrane Interactions Using HDX-MS
471
2
4
6
8
Retention (min)
Flow (μL / min)
0
50
100
0
25
50
0
5
10
15
20
Retention (min)
% B
0
50
100
0
25
50
Time (min)
Intens
y
t
i
Total Ion Chromatogram (TIC)
a
b
Short Blank Method
MS Method
Long MS/MS Method
Retention (min)
0
5
10
15
20
Retention (min)
Short MS/MS Method
0
2 0
4 0
6 0
0
50
100
0
25
50
0
50
100
0
25
50
%B
Flow (uL/min)
PH
KD
Soluble Akt
(Apo)
KD
ATP
PH
Akt +
Membrane
Membrane
with 5% PIP3
Non-Deuterated
Membrane Bound
Peptide 1
Peptide 2
0.0
2.5
5.0
7.5
10.0
12.5
15.0
17.5
20.0
Apo
Increasing HDX Time
Increasing HDX Time
1
10
100 1000
0
10
20
30
40
Relative Deuteron
Exchange
Apo
+ Mem
Peptide 1
0.3s
0.3s
0.3s
3s
3s
3s
30s
30s
30s
0.3s
0.3s
0.3s
3s
3s
3s
30s
30s
30s
1
10
100 1000
0
20
40
60
80
Time (s)
Relative Deuteron
Exchange
Peptide 2
c
d
Fig. 2 Layout of HDX-MS experiment. (a) Optimized LC methods for MS/MS (Long and Short), MS, and Short
Blank runs. The gradients of Mobile Phase A and Mobile Phase B shown have been designed for effective
elution and detection of peptides in limited time. Typically the Short MS/MS method (second from left) is run to
identify peptides generated during proteolysis; however, for larger proteins or proteins that have incomplete
coverage, the Long MS/MS method (far left) can be run which may increase coverage by allowing more time
for the spectrometer to select peptides for identification. (b) Example UHPLC peptide elution profile for Akt apo
using the LC-MS method. Almost all peptides have finished eluting by ~14 min, with the remaining signal
being primarily carryover and lipid constituents. (c) Example mass spectra data for two Akt peptides showing
differences in deuterium incorporation in the presence and absence of PIP 3 vesicles. Peptide 1 is from a region
in the PH domain that becomes more protected from exchange in the presence of membrane than in the
absence, indicating a putative membrane binding site. Peptide 2 is from a region in the kinase domain that is
protected from solvent by the PH domain in the autoinhibited apo state. When the PH domain binds to PIP 3 in
the membrane, this region becomes exposed to solvent which increases the exchange rate in that area. (d)
Deuterium incorporation curves for the two Akt peptides in the presence and absence of membrane. A
common concern in HDX data is the shape of the resulting HDX incorporation curves, and either convergence
or divergence in differences. The reason for different shapes is dependent on the intrinsic exchange rate of the
amides being protected/exposed. The curve for peptide 1 is representative of a region that is highly dynamic in
the apo state, with the fast exchanging amides becoming protected upon membrane binding. This leads to the
data converging at late time points. The curve for peptide 2 is an example of extremely stable amides in the
Apo state that become more dynamic upon membrane binding. This leads to the data diverging at late time
points. The regions that these peptides are located in are colored accordingly in the cartoon to the right, where
red indicates increased exchange and blue indicates decreased exchange
Probing Protein-Membrane Interactions Using HDX-MS
471