

whose CD spectrum and sequence are given in Fig. 1. Its only
aromatic group is one phenyl alanine of fairly weak absorbance,
so the LD signal can be attributed to the peptide backbone (see
Note 13).
3. Then consider each peptide transition. It is usually useful to
consider CD data simultaneously. From the LD of Fig. 9, we
deduce that at 50
C (the fluid phase) aurein is α-helical and
stably inserted into the membrane parallel to the lipids, but at
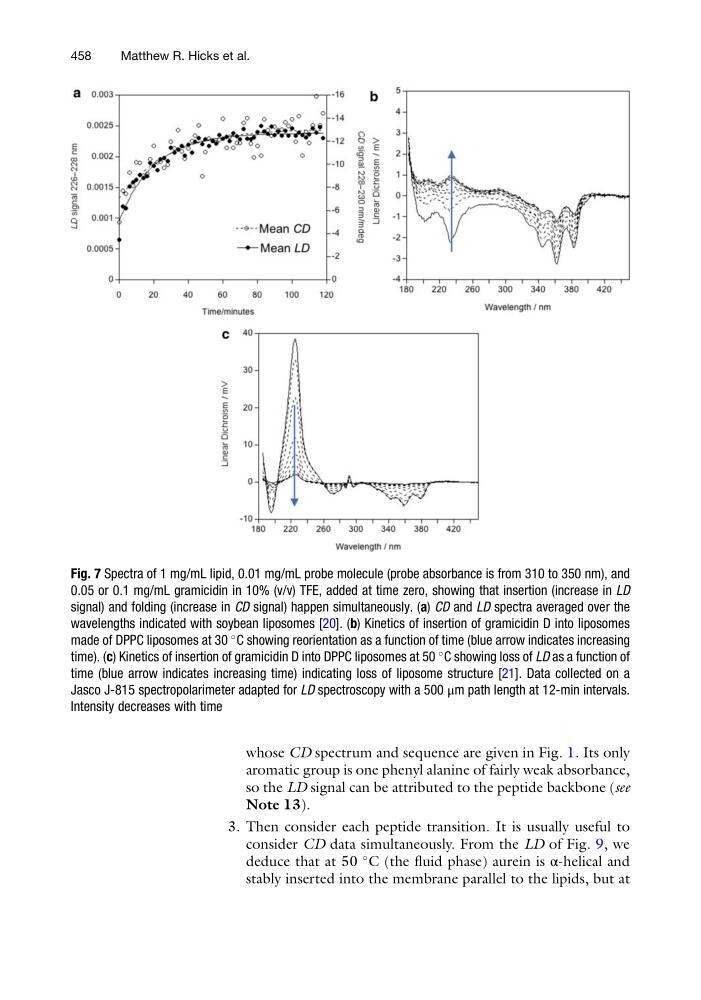
Fig. 7 Spectra of 1 mg/mL lipid, 0.01 mg/mL probe molecule (probe absorbance is from 310 to 350 nm), and
0.05 or 0.1 mg/mL gramicidin in 10% (v/v) TFE, added at time zero, showing that insertion (increase in LD
signal) and folding (increase in CD signal) happen simultaneously. (a) CD and LD spectra averaged over the
wavelengths indicated with soybean liposomes [20]. (b) Kinetics of insertion of gramicidin D into liposomes
made of DPPC liposomes at 30
C showing reorientation as a function of time (blue arrow indicates increasing
time). (c) Kinetics of insertion of gramicidin D into DPPC liposomes at 50
C showing loss of LD as a function of
time (blue arrow indicates increasing time) indicating loss of liposome structure [21]. Data collected on a
Jasco J-815 spectropolarimeter adapted for LD spectroscopy with a 500 μm path length at 12-min intervals.
Intensity decreases with time
458
Matthew R. Hicks et al.
aromatic group is one phenyl alanine of fairly weak absorbance,
so the LD signal can be attributed to the peptide backbone (see
Note 13).
3. Then consider each peptide transition. It is usually useful to
consider CD data simultaneously. From the LD of Fig. 9, we
deduce that at 50
C (the fluid phase) aurein is α-helical and
stably inserted into the membrane parallel to the lipids, but at
Fig. 7 Spectra of 1 mg/mL lipid, 0.01 mg/mL probe molecule (probe absorbance is from 310 to 350 nm), and
0.05 or 0.1 mg/mL gramicidin in 10% (v/v) TFE, added at time zero, showing that insertion (increase in LD
signal) and folding (increase in CD signal) happen simultaneously. (a) CD and LD spectra averaged over the
wavelengths indicated with soybean liposomes [20]. (b) Kinetics of insertion of gramicidin D into liposomes
made of DPPC liposomes at 30
C showing reorientation as a function of time (blue arrow indicates increasing
time). (c) Kinetics of insertion of gramicidin D into DPPC liposomes at 50
C showing loss of LD as a function of
time (blue arrow indicates increasing time) indicating loss of liposome structure [21]. Data collected on a
Jasco J-815 spectropolarimeter adapted for LD spectroscopy with a 500 μm path length at 12-min intervals.
Intensity decreases with time
458
Matthew R. Hicks et al.