

AB
½ ¼
1
2
Á A 0 þ B 0 þ K D
ð
Þ
À
ffiffiffiffiffiffiffiffiffiffiffiffiffiffiffiffiffiffiffiffiffiffiffiffiffiffiffiffiffiffiffiffiffiffiffiffiffiffiffiffiffiffiffiffiffiffiffiffiffiffiffiffiffiffiffiffiffiffiffiffiffiffiffiffiffiffiffiffiffiffi
1
2
Á A 0 þ B 0 þ K D
ð
Þ
2
À A 0 Á B 0
s
ð3Þ
B
½ ¼ B 0 À AB
½ , A
½ ¼ A 0 À AB
½
ð4Þ
The sedimentation coefficient of the reaction boundary can be
determined from the raw data using the diffusion-corrected differential sedimentation coefficient distribution model (continuous c(s)
distribution) of the program package SEDFIT [23]. In this
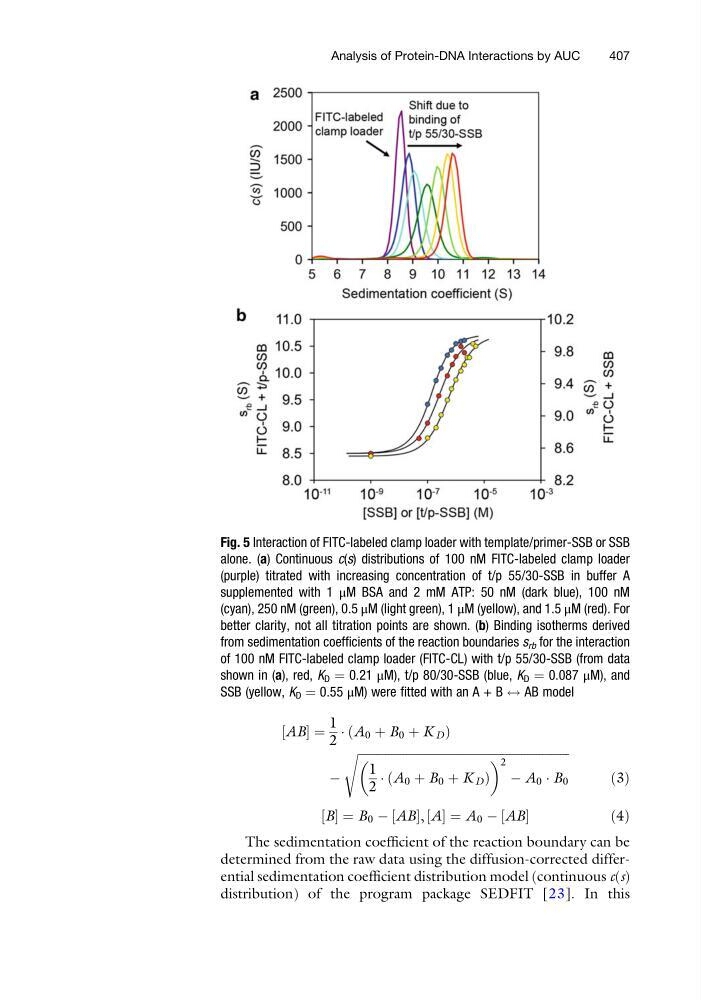
Fig. 5 Interaction of FITC-labeled clamp loader with template/primer-SSB or SSB
alone. (a) Continuous c(s) distributions of 100 nM FITC-labeled clamp loader
(purple) titrated with increasing concentration of t/p 55/30-SSB in buffer A
supplemented with 1 μM BSA and 2 mM ATP: 50 nM (dark blue), 100 nM
(cyan), 250 nM (green), 0.5 μM (light green), 1 μM (yellow), and 1.5 μM (red). For
better clarity, not all titration points are shown. (b) Binding isotherms derived
from sedimentation coefficients of the reaction boundaries s rb for the interaction
of 100 nM FITC-labeled clamp loader (FITC-CL) with t/p 55/30-SSB (from data
shown in (a), red, K D ¼ 0.21 μM), t/p 80/30-SSB (blue, K D ¼ 0.087 μM), and
SSB (yellow, K D ¼ 0.55 μM) were fitted with an A + B $ AB model
Analysis of Protein-DNA Interactions by AUC
407
½ ¼
1
2
Á A 0 þ B 0 þ K D
ð
Þ
À
ffiffiffiffiffiffiffiffiffiffiffiffiffiffiffiffiffiffiffiffiffiffiffiffiffiffiffiffiffiffiffiffiffiffiffiffiffiffiffiffiffiffiffiffiffiffiffiffiffiffiffiffiffiffiffiffiffiffiffiffiffiffiffiffiffiffiffiffiffiffi
1
2
Á A 0 þ B 0 þ K D
ð
Þ
2
À A 0 Á B 0
s
ð3Þ
B
½ ¼ B 0 À AB
½ , A
½ ¼ A 0 À AB
½
ð4Þ
The sedimentation coefficient of the reaction boundary can be
determined from the raw data using the diffusion-corrected differential sedimentation coefficient distribution model (continuous c(s)
distribution) of the program package SEDFIT [23]. In this
Fig. 5 Interaction of FITC-labeled clamp loader with template/primer-SSB or SSB
alone. (a) Continuous c(s) distributions of 100 nM FITC-labeled clamp loader
(purple) titrated with increasing concentration of t/p 55/30-SSB in buffer A
supplemented with 1 μM BSA and 2 mM ATP: 50 nM (dark blue), 100 nM
(cyan), 250 nM (green), 0.5 μM (light green), 1 μM (yellow), and 1.5 μM (red). For
better clarity, not all titration points are shown. (b) Binding isotherms derived
from sedimentation coefficients of the reaction boundaries s rb for the interaction
of 100 nM FITC-labeled clamp loader (FITC-CL) with t/p 55/30-SSB (from data
shown in (a), red, K D ¼ 0.21 μM), t/p 80/30-SSB (blue, K D ¼ 0.087 μM), and
SSB (yellow, K D ¼ 0.55 μM) were fitted with an A + B $ AB model
Analysis of Protein-DNA Interactions by AUC
407