

3.5 Further Possible
Experiments and Uses
The method described gives the technical details to run one cycle
with the ReDCaT chip. This can be written as a “method” to run
automatically, which enables any number of DNA sequences, DNA
lengths, and protein samples and concentrations to be tested in
series. This makes the method amenable to a wide range of experiments [7–16].
Initially the method might be used to identify whether a DNA
fragment contains a sequence that a particular protein binds
to. This might be to verify a binding site identified by another
method (like CHIP-seq) or could be used to screen a region of
DNA for a potential binding site. Once binding has been identified,
the smallest length of DNA that is sufficient for the interaction can
be determined. This involves truncating the binding site from each
end and testing to see when the interaction is lost. How to design
this kind of “footprinting by SPR” experiment is detailed in [7].
The method has also been used to quantify interactions and to
obtain kinetic and affinity parameters. Moreover, it can test the
effects of site-directed mutations, or it can be used to rank the
binding of a single protein to a series of different consensus
sequences. For weaker interactions, the test DNA can be retained
on the chip and at least five concentrations of protein ranging from
0.1 to 10 times the estimated affinity can be tested in duplicate. For
stronger interactions, the DNA with any protein still bound must
be removed and new DNA reloaded for each cycle. These experiments should be designed and analyzed using the same principles as
for any other affinity or kinetic SPR experiment.
If a ligand is thought to interrupt the interaction, this can also
be investigated using the ReDCaT method. The ligand of interest
can be added in increasing concentrations and the effect on binding
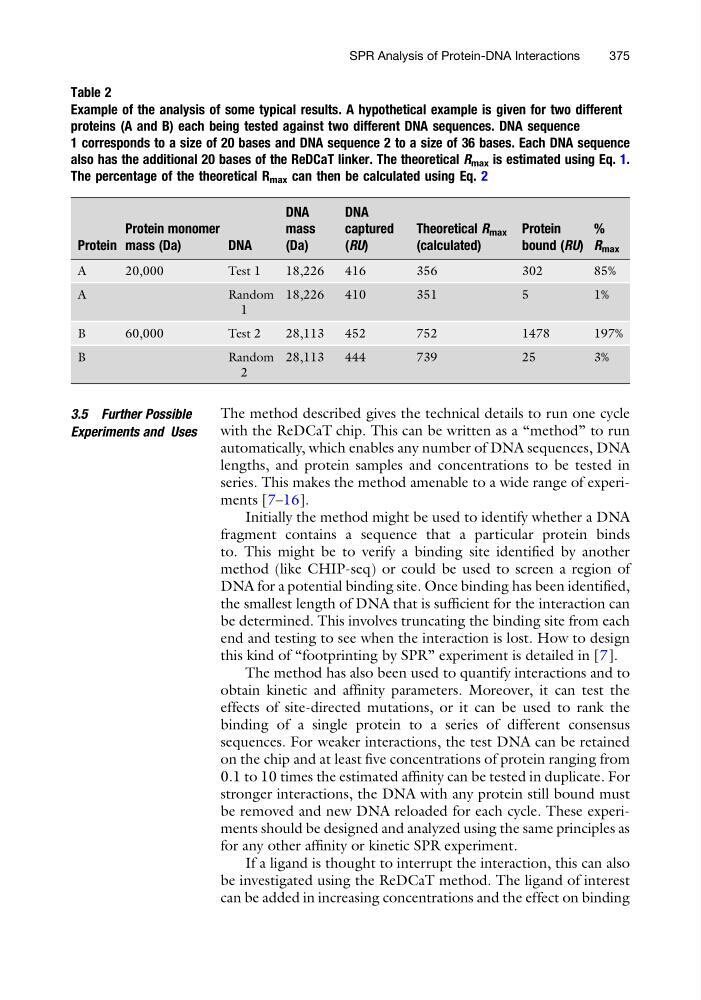
Table 2
Example of the analysis of some typical results. A hypothetical example is given for two different
proteins (A and B) each being tested against two different DNA sequences. DNA sequence
1 corresponds to a size of 20 bases and DNA sequence 2 to a size of 36 bases. Each DNA sequence
also has the additional 20 bases of the ReDCaT linker. The theoretical R max is estimated using Eq. 1.
The percentage of the theoretical R max can then be calculated using Eq. 2
Protein
Protein monomer
mass (Da)
DNA
DNA
mass
(Da)
DNA
captured
(RU)
Theoretical R max
(calculated)
Protein
bound (RU)
%
R max
A
20,000
Test 1
18,226
416
356
302
85%
A
Random
1
18,226
410
351
5
1%
B
60,000
Test 2
28,113
452
752
1478
197%
B
Random
2
28,113
444
739
25
3%
SPR Analysis of Protein-DNA Interactions
375
Experiments and Uses
The method described gives the technical details to run one cycle
with the ReDCaT chip. This can be written as a “method” to run
automatically, which enables any number of DNA sequences, DNA
lengths, and protein samples and concentrations to be tested in
series. This makes the method amenable to a wide range of experiments [7–16].
Initially the method might be used to identify whether a DNA
fragment contains a sequence that a particular protein binds
to. This might be to verify a binding site identified by another
method (like CHIP-seq) or could be used to screen a region of
DNA for a potential binding site. Once binding has been identified,
the smallest length of DNA that is sufficient for the interaction can
be determined. This involves truncating the binding site from each
end and testing to see when the interaction is lost. How to design
this kind of “footprinting by SPR” experiment is detailed in [7].
The method has also been used to quantify interactions and to
obtain kinetic and affinity parameters. Moreover, it can test the
effects of site-directed mutations, or it can be used to rank the
binding of a single protein to a series of different consensus
sequences. For weaker interactions, the test DNA can be retained
on the chip and at least five concentrations of protein ranging from
0.1 to 10 times the estimated affinity can be tested in duplicate. For
stronger interactions, the DNA with any protein still bound must
be removed and new DNA reloaded for each cycle. These experiments should be designed and analyzed using the same principles as
for any other affinity or kinetic SPR experiment.
If a ligand is thought to interrupt the interaction, this can also
be investigated using the ReDCaT method. The ligand of interest
can be added in increasing concentrations and the effect on binding
Table 2
Example of the analysis of some typical results. A hypothetical example is given for two different
proteins (A and B) each being tested against two different DNA sequences. DNA sequence
1 corresponds to a size of 20 bases and DNA sequence 2 to a size of 36 bases. Each DNA sequence
also has the additional 20 bases of the ReDCaT linker. The theoretical R max is estimated using Eq. 1.
The percentage of the theoretical R max can then be calculated using Eq. 2
Protein
Protein monomer
mass (Da)
DNA
DNA
mass
(Da)
DNA
captured
(RU)
Theoretical R max
(calculated)
Protein
bound (RU)
%
R max
A
20,000
Test 1
18,226
416
356
302
85%
A
Random
1
18,226
410
351
5
1%
B
60,000
Test 2
28,113
452
752
1478
197%
B
Random
2
28,113
444
739
25
3%
SPR Analysis of Protein-DNA Interactions
375