

for double referencing. When the experiment is completed, the
regenerated chip can be removed from the instrument and stored
in buffer at 4
C until required again.
3.3 Analysis
of Results
To readily compare results across multiple cycles, the data can be
normalized by correcting for different capture levels, lengths of
DNA, and different protein samples. In SPR, binding events are
recorded as Response Units (RU), and it is important to compare
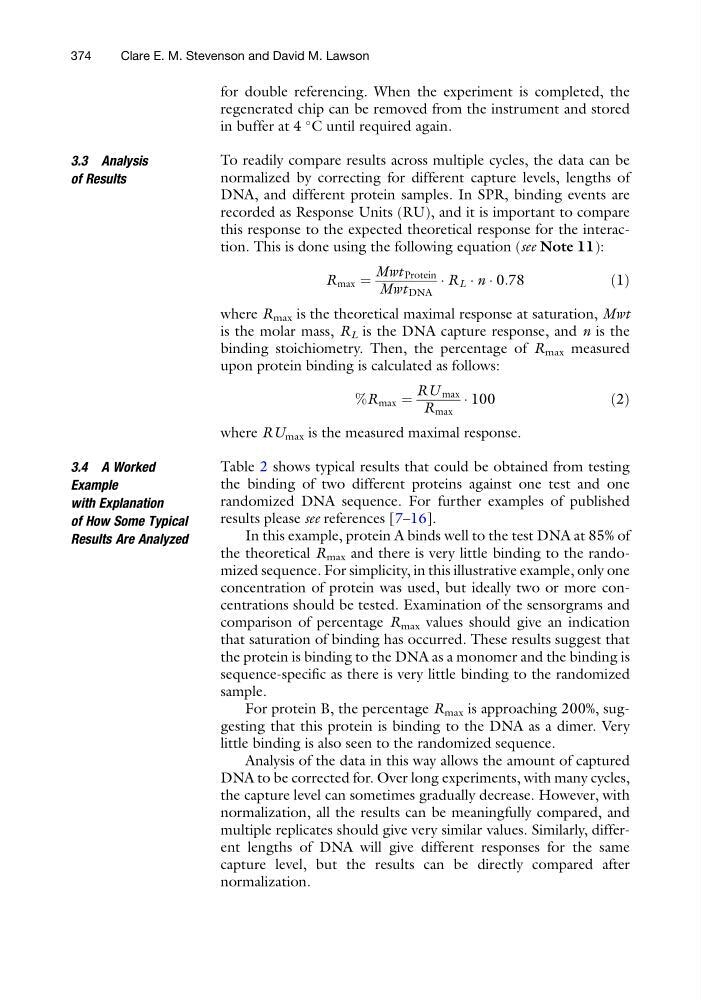
this response to the expected theoretical response for the interaction. This is done using the following equation (see Note 11):
R max ¼
Mwt Protein
Mwt DNA
Á R L Á n Á 0:78
ð1Þ
where R max is the theoretical maximal response at saturation, Mwt
is the molar mass, R L is the DNA capture response, and n is the
binding stoichiometry. Then, the percentage of R max measured
upon protein binding is calculated as follows:
%R max ¼
RU max
R max
Á 100
ð2Þ
where RU max is the measured maximal response.
3.4 A Worked
Example
with Explanation
of How Some Typical
Results Are Analyzed
Table 2 shows typical results that could be obtained from testing
the binding of two different proteins against one test and one
randomized DNA sequence. For further examples of published
results please see references [7–16].
In this example, protein A binds well to the test DNA at 85% of
the theoretical R max and there is very little binding to the randomized sequence. For simplicity, in this illustrative example, only one
concentration of protein was used, but ideally two or more concentrations should be tested. Examination of the sensorgrams and
comparison of percentage R max values should give an indication
that saturation of binding has occurred. These results suggest that
the protein is binding to the DNA as a monomer and the binding is
sequence-specific as there is very little binding to the randomized
sample.
For protein B, the percentage R max is approaching 200%, suggesting that this protein is binding to the DNA as a dimer. Very
little binding is also seen to the randomized sequence.
Analysis of the data in this way allows the amount of captured
DNA to be corrected for. Over long experiments, with many cycles,
the capture level can sometimes gradually decrease. However, with
normalization, all the results can be meaningfully compared, and
multiple replicates should give very similar values. Similarly, different lengths of DNA will give different responses for the same
capture level, but the results can be directly compared after
normalization.
374
Clare E. M. Stevenson and David M. Lawson
regenerated chip can be removed from the instrument and stored
in buffer at 4
C until required again.
3.3 Analysis
of Results
To readily compare results across multiple cycles, the data can be
normalized by correcting for different capture levels, lengths of
DNA, and different protein samples. In SPR, binding events are
recorded as Response Units (RU), and it is important to compare
this response to the expected theoretical response for the interaction. This is done using the following equation (see Note 11):
R max ¼
Mwt Protein
Mwt DNA
Á R L Á n Á 0:78
ð1Þ
where R max is the theoretical maximal response at saturation, Mwt
is the molar mass, R L is the DNA capture response, and n is the
binding stoichiometry. Then, the percentage of R max measured
upon protein binding is calculated as follows:
%R max ¼
RU max
R max
Á 100
ð2Þ
where RU max is the measured maximal response.
3.4 A Worked
Example
with Explanation
of How Some Typical
Results Are Analyzed
Table 2 shows typical results that could be obtained from testing
the binding of two different proteins against one test and one
randomized DNA sequence. For further examples of published
results please see references [7–16].
In this example, protein A binds well to the test DNA at 85% of
the theoretical R max and there is very little binding to the randomized sequence. For simplicity, in this illustrative example, only one
concentration of protein was used, but ideally two or more concentrations should be tested. Examination of the sensorgrams and
comparison of percentage R max values should give an indication
that saturation of binding has occurred. These results suggest that
the protein is binding to the DNA as a monomer and the binding is
sequence-specific as there is very little binding to the randomized
sample.
For protein B, the percentage R max is approaching 200%, suggesting that this protein is binding to the DNA as a dimer. Very
little binding is also seen to the randomized sequence.
Analysis of the data in this way allows the amount of captured
DNA to be corrected for. Over long experiments, with many cycles,
the capture level can sometimes gradually decrease. However, with
normalization, all the results can be meaningfully compared, and
multiple replicates should give very similar values. Similarly, different lengths of DNA will give different responses for the same
capture level, but the results can be directly compared after
normalization.
374
Clare E. M. Stevenson and David M. Lawson