

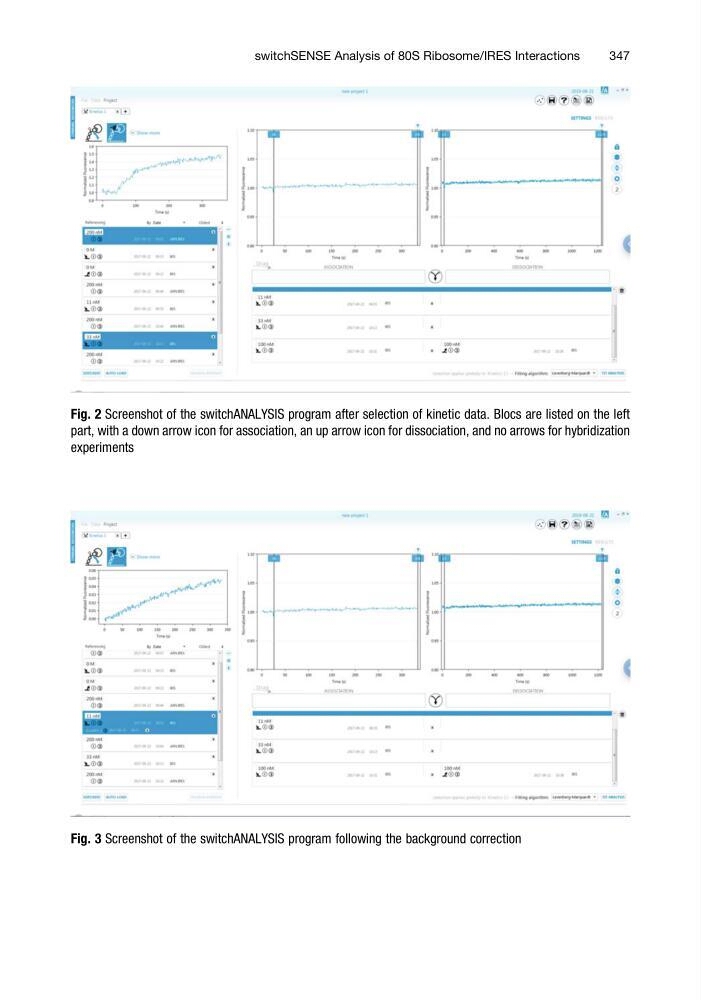
Fig. 2 Screenshot of the switchANALYSIS program after selection of kinetic data. Blocs are listed on the left
part, with a down arrow icon for association, an up arrow icon for dissociation, and no arrows for hybridization
experiments
Fig. 3 Screenshot of the switchANALYSIS program following the background correction
switchSENSE Analysis of 80S Ribosome/IRES Interactions
347
part, with a down arrow icon for association, an up arrow icon for dissociation, and no arrows for hybridization
experiments
Fig. 3 Screenshot of the switchANALYSIS program following the background correction
switchSENSE Analysis of 80S Ribosome/IRES Interactions
347