

8. Set the gain and focal height:
(a) Run gain and focal height adjustment on the well with the
highest P i concentration.
(b) Set gain, so that the output signal is well above background, but far lower than saturation (in this example
gain 1300, gives ~35,000 RUs).
(c) Run the focal height adjustment (gain adjustment
switched off) for several wells to check that there is no
large variation between wells (<Æ0.1 mm) and set to an
average (here 7.0 mm).
9. Run measurement (about 5 min).
To analyze data:
10. Plot the fluorescence signal versus time for all P i concentrations (and ATP test solutions), and calculate the average of
the fluorescence signal over the time points leaving out the
initial time points if the signal is not stable (see Fig. 3a).
11. Plot the averaged fluorescence (F) versus P i concentration to
generate the standard curve. Fit a standard curve by linear
regression (see Fig. 3b):
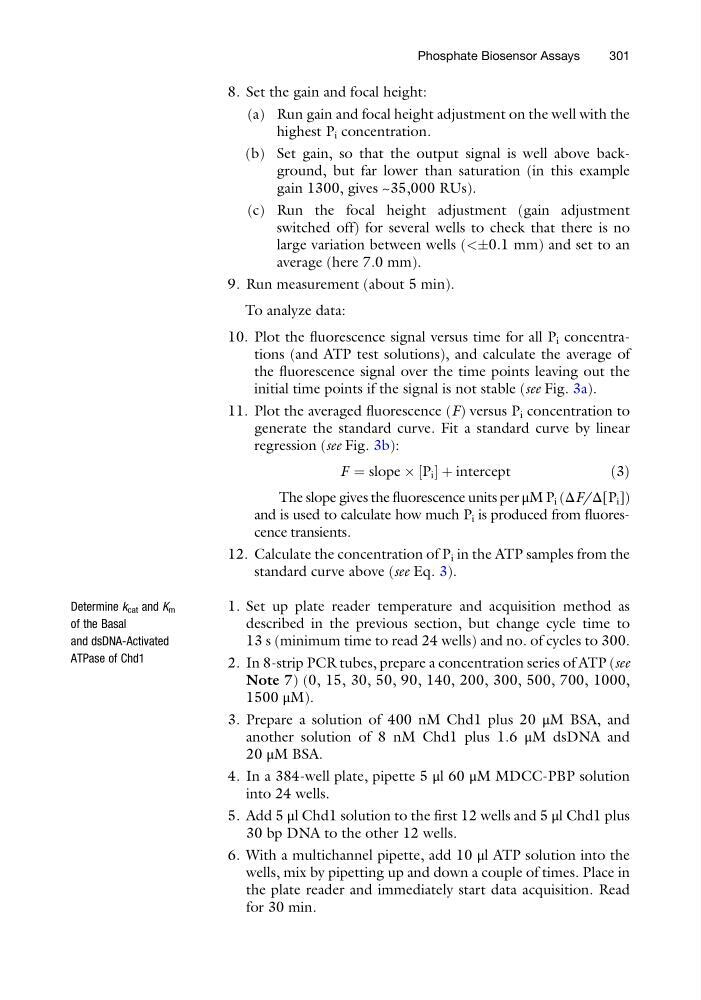
F ¼ slope  P i
½ þ intercept
ð3Þ
The slope gives the fluorescence units per μM P i (ΔF/Δ[P i ])
and is used to calculate how much P i is produced from fluorescence transients.
12. Calculate the concentration of P i in the ATP samples from the
standard curve above (see Eq. 3).
Determine k cat and K m
of the Basal
and dsDNA-Activated
ATPase of Chd1
1. Set up plate reader temperature and acquisition method as
described in the previous section, but change cycle time to
13 s (minimum time to read 24 wells) and no. of cycles to 300.
2. In 8-strip PCR tubes, prepare a concentration series of ATP (see
Note 7) (0, 15, 30, 50, 90, 140, 200, 300, 500, 700, 1000,
1500 μM).
3. Prepare a solution of 400 nM Chd1 plus 20 μM BSA, and
another solution of 8 nM Chd1 plus 1.6 μM dsDNA and
20 μM BSA.
4. In a 384-well plate, pipette 5 μl 60 μM MDCC-PBP solution
into 24 wells.
5. Add 5 μl Chd1 solution to the first 12 wells and 5 μl Chd1 plus
30 bp DNA to the other 12 wells.
6. With a multichannel pipette, add 10 μl ATP solution into the
wells, mix by pipetting up and down a couple of times. Place in
the plate reader and immediately start data acquisition. Read
for 30 min.
Phosphate Biosensor Assays
301
(a) Run gain and focal height adjustment on the well with the
highest P i concentration.
(b) Set gain, so that the output signal is well above background, but far lower than saturation (in this example
gain 1300, gives ~35,000 RUs).
(c) Run the focal height adjustment (gain adjustment
switched off) for several wells to check that there is no
large variation between wells (<Æ0.1 mm) and set to an
average (here 7.0 mm).
9. Run measurement (about 5 min).
To analyze data:
10. Plot the fluorescence signal versus time for all P i concentrations (and ATP test solutions), and calculate the average of
the fluorescence signal over the time points leaving out the
initial time points if the signal is not stable (see Fig. 3a).
11. Plot the averaged fluorescence (F) versus P i concentration to
generate the standard curve. Fit a standard curve by linear
regression (see Fig. 3b):
F ¼ slope  P i
½ þ intercept
ð3Þ
The slope gives the fluorescence units per μM P i (ΔF/Δ[P i ])
and is used to calculate how much P i is produced from fluorescence transients.
12. Calculate the concentration of P i in the ATP samples from the
standard curve above (see Eq. 3).
Determine k cat and K m
of the Basal
and dsDNA-Activated
ATPase of Chd1
1. Set up plate reader temperature and acquisition method as
described in the previous section, but change cycle time to
13 s (minimum time to read 24 wells) and no. of cycles to 300.
2. In 8-strip PCR tubes, prepare a concentration series of ATP (see
Note 7) (0, 15, 30, 50, 90, 140, 200, 300, 500, 700, 1000,
1500 μM).
3. Prepare a solution of 400 nM Chd1 plus 20 μM BSA, and
another solution of 8 nM Chd1 plus 1.6 μM dsDNA and
20 μM BSA.
4. In a 384-well plate, pipette 5 μl 60 μM MDCC-PBP solution
into 24 wells.
5. Add 5 μl Chd1 solution to the first 12 wells and 5 μl Chd1 plus
30 bp DNA to the other 12 wells.
6. With a multichannel pipette, add 10 μl ATP solution into the
wells, mix by pipetting up and down a couple of times. Place in
the plate reader and immediately start data acquisition. Read
for 30 min.
Phosphate Biosensor Assays
301