

where Y is the measured signal, Min is the anisotropy value found
with fully displaced probe (see Note 23), Max is the anisotropy
value found with fully bound probe, IC 50 is the concentration of
test compound leading to 50% probe displacement, and h is the Hill
slope (see Note 24).
Compounds may then be rank-ordered by IC 50 as a measure of
the effectiveness of probe displacement, which reflects the affinity
of the test compound, although to assess true binding affinity, the
calculations below must be used.
3.4.1 Calculation
of Affinity from IC 50
It is important to note that the method of Cheng and Prusoff [16]
to calculate a compound K i is not appropriate for fluorescence
polarization assays because these assays are established in such a
way that the assumption [L] t ¼ [L] f , i.e., the concentration of the
total probe added is equivalent to the free concentration, is not
valid due to significant depletion of the free probe by binding to
protein in order to generate the anisotropic signal.
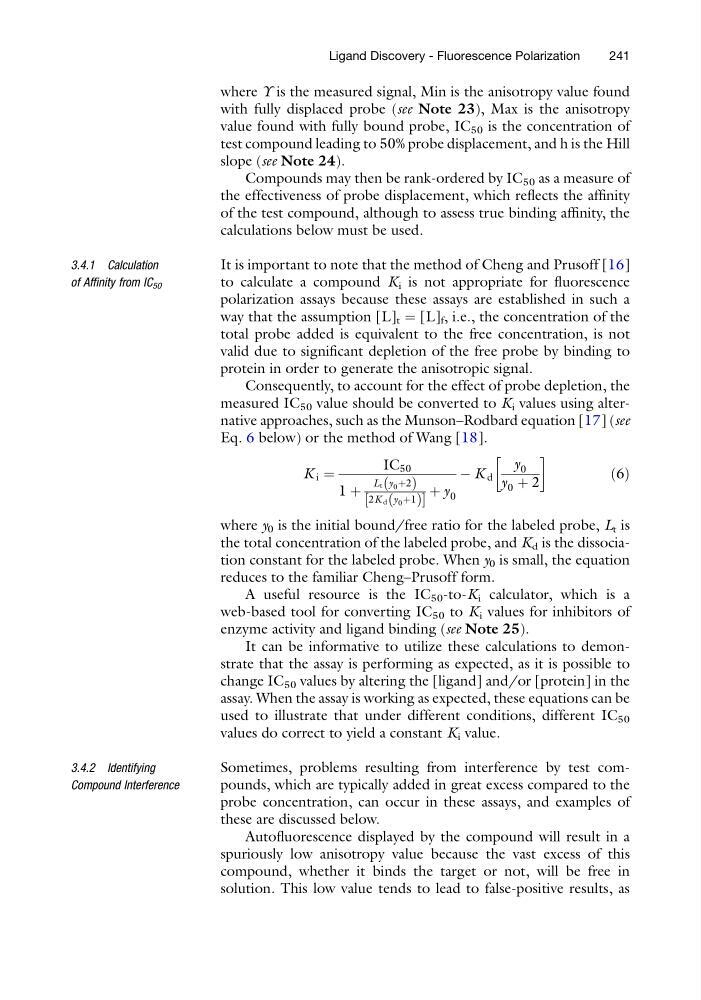
Consequently, to account for the effect of probe depletion, the
measured IC 50 value should be converted to K i values using alternative approaches, such as the Munson–Rodbard equation [17] (see
Eq. 6 below) or the method of Wang [18].
K i ¼
IC 50
1 þ
L t y 0 þ2
ð
Þ
2K d y 0 þ1
ð
Þ
½
þ y 0
À K d
y 0
y 0 þ 2
!
ð6Þ
where y 0 is the initial bound/free ratio for the labeled probe, L t is
the total concentration of the labeled probe, and K d is the dissociation constant for the labeled probe. When y 0 is small, the equation
reduces to the familiar Cheng–Prusoff form.
A useful resource is the IC 50 -to-K i calculator, which is a
web-based tool for converting IC 50 to K i values for inhibitors of
enzyme activity and ligand binding (see Note 25).
It can be informative to utilize these calculations to demonstrate that the assay is performing as expected, as it is possible to
change IC 50 values by altering the [ligand] and/or [protein] in the
assay. When the assay is working as expected, these equations can be
used to illustrate that under different conditions, different IC 50
values do correct to yield a constant K i value.
3.4.2 Identifying
Compound Interference
Sometimes, problems resulting from interference by test compounds, which are typically added in great excess compared to the
probe concentration, can occur in these assays, and examples of
these are discussed below.
Autofluorescence displayed by the compound will result in a
spuriously low anisotropy value because the vast excess of this
compound, whether it binds the target or not, will be free in
solution. This low value tends to lead to false-positive results, as
Ligand Discovery - Fluorescence Polarization
241
with fully displaced probe (see Note 23), Max is the anisotropy
value found with fully bound probe, IC 50 is the concentration of
test compound leading to 50% probe displacement, and h is the Hill
slope (see Note 24).
Compounds may then be rank-ordered by IC 50 as a measure of
the effectiveness of probe displacement, which reflects the affinity
of the test compound, although to assess true binding affinity, the
calculations below must be used.
3.4.1 Calculation
of Affinity from IC 50
It is important to note that the method of Cheng and Prusoff [16]
to calculate a compound K i is not appropriate for fluorescence
polarization assays because these assays are established in such a
way that the assumption [L] t ¼ [L] f , i.e., the concentration of the
total probe added is equivalent to the free concentration, is not
valid due to significant depletion of the free probe by binding to
protein in order to generate the anisotropic signal.
Consequently, to account for the effect of probe depletion, the
measured IC 50 value should be converted to K i values using alternative approaches, such as the Munson–Rodbard equation [17] (see
Eq. 6 below) or the method of Wang [18].
K i ¼
IC 50
1 þ
L t y 0 þ2
ð
Þ
2K d y 0 þ1
ð
Þ
½
þ y 0
À K d
y 0
y 0 þ 2
!
ð6Þ
where y 0 is the initial bound/free ratio for the labeled probe, L t is
the total concentration of the labeled probe, and K d is the dissociation constant for the labeled probe. When y 0 is small, the equation
reduces to the familiar Cheng–Prusoff form.
A useful resource is the IC 50 -to-K i calculator, which is a
web-based tool for converting IC 50 to K i values for inhibitors of
enzyme activity and ligand binding (see Note 25).
It can be informative to utilize these calculations to demonstrate that the assay is performing as expected, as it is possible to
change IC 50 values by altering the [ligand] and/or [protein] in the
assay. When the assay is working as expected, these equations can be
used to illustrate that under different conditions, different IC 50
values do correct to yield a constant K i value.
3.4.2 Identifying
Compound Interference
Sometimes, problems resulting from interference by test compounds, which are typically added in great excess compared to the
probe concentration, can occur in these assays, and examples of
these are discussed below.
Autofluorescence displayed by the compound will result in a
spuriously low anisotropy value because the vast excess of this
compound, whether it binds the target or not, will be free in
solution. This low value tends to lead to false-positive results, as
Ligand Discovery - Fluorescence Polarization
241