

degradation or PTM inhomogeneity, can be detected. Certainly, if a
protein is to be produced and investigated repeatedly, NMR is the
benchmark standard for checking batch-to-batch consistency, the
impact of freeze-thaw cycles, effects of changes in buffer composition, or the production process. NMR spectroscopy may also be the
only viable structural assessment method for proteins that are fully
or largely intrinsically disordered.
Here, however, we will concern ourselves only with the application of CD spectroscopy given its widespread availability and
relative simplicity for novice users.
Protein CD spectroscopy is based on the fact that amino acids and
secondary and tertiary structures of proteins are chiral and as such
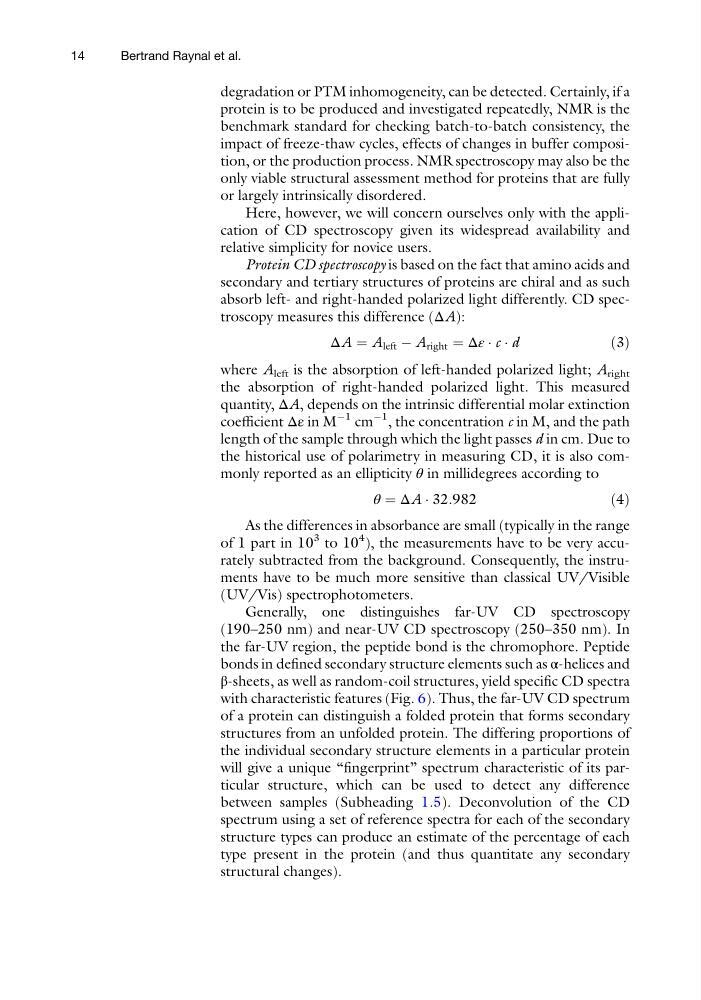
absorb left- and right-handed polarized light differently. CD spectroscopy measures this difference (ΔA):
ΔA ¼ A left À A right ¼ Δε Á c Á d
ð3Þ
where A left is the absorption of left-handed polarized light; A right
the absorption of right-handed polarized light. This measured
quantity, ΔA, depends on the intrinsic differential molar extinction
coefficient Δε in M
À1 cm
À1 , the concentration c in M, and the path
length of the sample through which the light passes d in cm. Due to
the historical use of polarimetry in measuring CD, it is also commonly reported as an ellipticity θ in millidegrees according to
θ ¼ ΔA Á 32:982
ð4Þ
As the differences in absorbance are small (typically in the range
of 1 part in 10
3 to 10
4 ), the measurements have to be very accurately subtracted from the background. Consequently, the instruments have to be much more sensitive than classical UV/Visible
(UV/Vis) spectrophotometers.
Generally, one distinguishes far-UV CD spectroscopy
(190–250 nm) and near-UV CD spectroscopy (250–350 nm). In
the far-UV region, the peptide bond is the chromophore. Peptide
bonds in defined secondary structure elements such as α-helices and
β-sheets, as well as random-coil structures, yield specific CD spectra
with characteristic features (Fig. 6). Thus, the far-UV CD spectrum
of a protein can distinguish a folded protein that forms secondary
structures from an unfolded protein. The differing proportions of
the individual secondary structure elements in a particular protein
will give a unique “fingerprint” spectrum characteristic of its particular structure, which can be used to detect any difference
between samples (Subheading 1.5). Deconvolution of the CD
spectrum using a set of reference spectra for each of the secondary
structure types can produce an estimate of the percentage of each
type present in the protein (and thus quantitate any secondary
structural changes).
14
Bertrand Raynal et al.
protein is to be produced and investigated repeatedly, NMR is the
benchmark standard for checking batch-to-batch consistency, the
impact of freeze-thaw cycles, effects of changes in buffer composition, or the production process. NMR spectroscopy may also be the
only viable structural assessment method for proteins that are fully
or largely intrinsically disordered.
Here, however, we will concern ourselves only with the application of CD spectroscopy given its widespread availability and
relative simplicity for novice users.
Protein CD spectroscopy is based on the fact that amino acids and
secondary and tertiary structures of proteins are chiral and as such
absorb left- and right-handed polarized light differently. CD spectroscopy measures this difference (ΔA):
ΔA ¼ A left À A right ¼ Δε Á c Á d
ð3Þ
where A left is the absorption of left-handed polarized light; A right
the absorption of right-handed polarized light. This measured
quantity, ΔA, depends on the intrinsic differential molar extinction
coefficient Δε in M
À1 cm
À1 , the concentration c in M, and the path
length of the sample through which the light passes d in cm. Due to
the historical use of polarimetry in measuring CD, it is also commonly reported as an ellipticity θ in millidegrees according to
θ ¼ ΔA Á 32:982
ð4Þ
As the differences in absorbance are small (typically in the range
of 1 part in 10
3 to 10
4 ), the measurements have to be very accurately subtracted from the background. Consequently, the instruments have to be much more sensitive than classical UV/Visible
(UV/Vis) spectrophotometers.
Generally, one distinguishes far-UV CD spectroscopy
(190–250 nm) and near-UV CD spectroscopy (250–350 nm). In
the far-UV region, the peptide bond is the chromophore. Peptide
bonds in defined secondary structure elements such as α-helices and
β-sheets, as well as random-coil structures, yield specific CD spectra
with characteristic features (Fig. 6). Thus, the far-UV CD spectrum
of a protein can distinguish a folded protein that forms secondary
structures from an unfolded protein. The differing proportions of
the individual secondary structure elements in a particular protein
will give a unique “fingerprint” spectrum characteristic of its particular structure, which can be used to detect any difference
between samples (Subheading 1.5). Deconvolution of the CD
spectrum using a set of reference spectra for each of the secondary
structure types can produce an estimate of the percentage of each
type present in the protein (and thus quantitate any secondary
structural changes).
14
Bertrand Raynal et al.