

calculation. This issue is exacerbated when testing compounds in a
concentration-response format as an increasing concentration of
compound mimics the increasing concentration of internal standard and hence appears as a decreasing product when the ratio is
calculated. A concentration-response curve is therefore seen, which
is simply a false positive (Fig. 4).
3.7 Data Analysis
Currently, raw MS files are exported and converted into .csv files for
import into separate data analysis software. The data structure is in
a plate map format, with one .csv file per plate, and one plate map
per target mass (see Note 13). For AMI-MS assays, when using an
internal standard, a ratio of product divided by internal standard is
calculated. If an internal standard is not available, analysis may be
more difficult, as discussed in Note 12. In this case, a ratio of
substrate to product is calculated. In both cases, the % effect is
converted to a Z-score (see Note 14) that is used to identify active
compounds. Ratios must be used for this analysis as product and
substrate vary from well to well due to differential firing, as
described above.
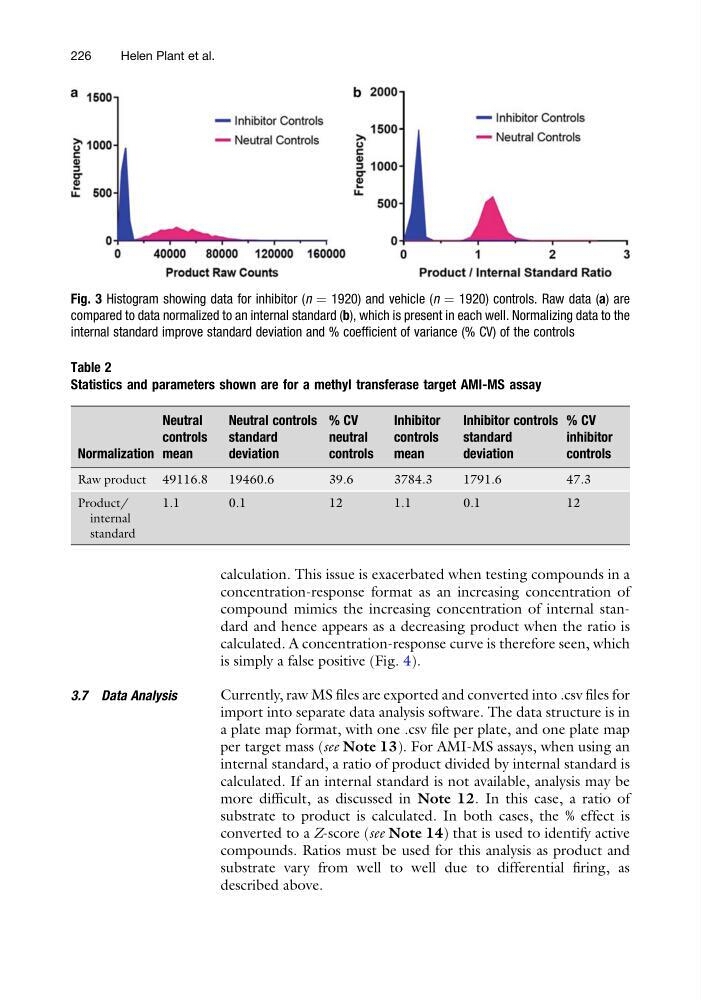
Fig. 3 Histogram showing data for inhibitor (n ¼ 1920) and vehicle (n ¼ 1920) controls. Raw data (a) are
compared to data normalized to an internal standard (b), which is present in each well. Normalizing data to the
internal standard improve standard deviation and % coefficient of variance (% CV) of the controls
Table 2
Statistics and parameters shown are for a methyl transferase target AMI-MS assay
Normalization
Neutral
controls
mean
Neutral controls
standard
deviation
% CV
neutral
controls
Inhibitor
controls
mean
Inhibitor controls
standard
deviation
% CV
inhibitor
controls
Raw product 49116.8
19460.6
39.6
3784.3
1791.6
47.3
Product/
internal
standard
1.1
0.1
12
1.1
0.1
12
226
Helen Plant et al.
concentration-response format as an increasing concentration of
compound mimics the increasing concentration of internal standard and hence appears as a decreasing product when the ratio is
calculated. A concentration-response curve is therefore seen, which
is simply a false positive (Fig. 4).
3.7 Data Analysis
Currently, raw MS files are exported and converted into .csv files for
import into separate data analysis software. The data structure is in
a plate map format, with one .csv file per plate, and one plate map
per target mass (see Note 13). For AMI-MS assays, when using an
internal standard, a ratio of product divided by internal standard is
calculated. If an internal standard is not available, analysis may be
more difficult, as discussed in Note 12. In this case, a ratio of
substrate to product is calculated. In both cases, the % effect is
converted to a Z-score (see Note 14) that is used to identify active
compounds. Ratios must be used for this analysis as product and
substrate vary from well to well due to differential firing, as
described above.
Fig. 3 Histogram showing data for inhibitor (n ¼ 1920) and vehicle (n ¼ 1920) controls. Raw data (a) are
compared to data normalized to an internal standard (b), which is present in each well. Normalizing data to the
internal standard improve standard deviation and % coefficient of variance (% CV) of the controls
Table 2
Statistics and parameters shown are for a methyl transferase target AMI-MS assay
Normalization
Neutral
controls
mean
Neutral controls
standard
deviation
% CV
neutral
controls
Inhibitor
controls
mean
Inhibitor controls
standard
deviation
% CV
inhibitor
controls
Raw product 49116.8
19460.6
39.6
3784.3
1791.6
47.3
Product/
internal
standard
1.1
0.1
12
1.1
0.1
12
226
Helen Plant et al.