

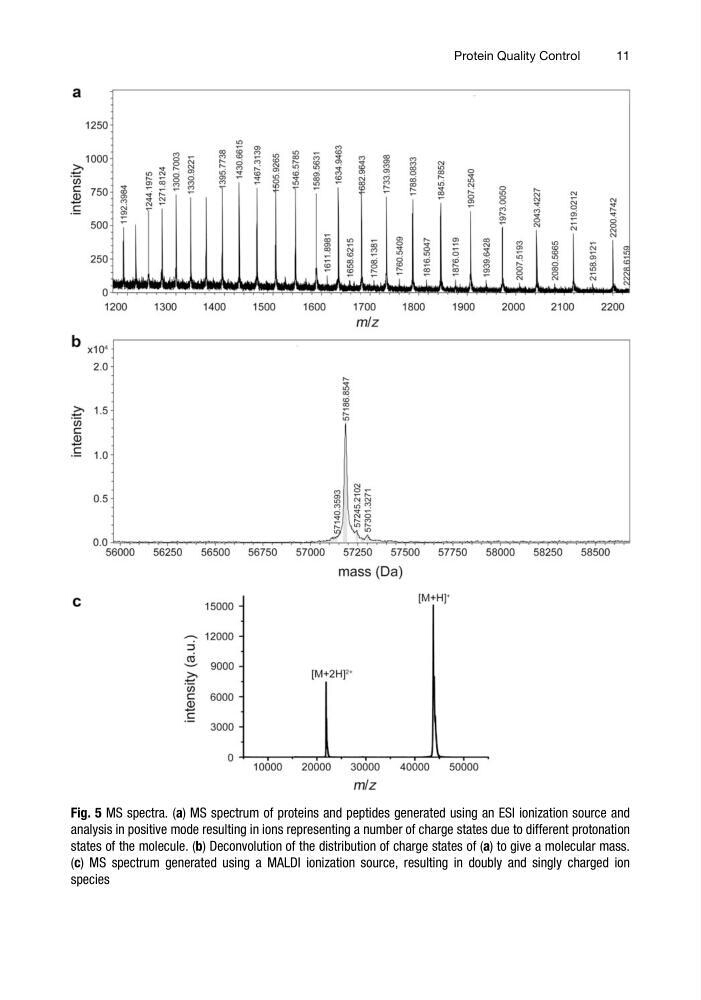
Fig. 5 MS spectra. (a) MS spectrum of proteins and peptides generated using an ESI ionization source and
analysis in positive mode resulting in ions representing a number of charge states due to different protonation
states of the molecule. (b) Deconvolution of the distribution of charge states of (a) to give a molecular mass.
(c) MS spectrum generated using a MALDI ionization source, resulting in doubly and singly charged ion
species
Protein Quality Control
11
analysis in positive mode resulting in ions representing a number of charge states due to different protonation
states of the molecule. (b) Deconvolution of the distribution of charge states of (a) to give a molecular mass.
(c) MS spectrum generated using a MALDI ionization source, resulting in doubly and singly charged ion
species
Protein Quality Control
11