

of interest can be readily separated and quantified via inline concentration detection. However, although the gel filtration resins are
intended to be “inert,” some proteins interact with them, falsifying
results (or even making SEC impossible). One should also keep in
mind that the protein sample will be significantly diluted during the
analytical SEC (at least by a factor of 2), which might alter the
equilibria between any oligomeric species present.
In order to determine the absolute molecular weight of each
eluted species, an inline static light scattering (SLS) detector [13],
in combination with a UV or a refractive index (RI) detector, must
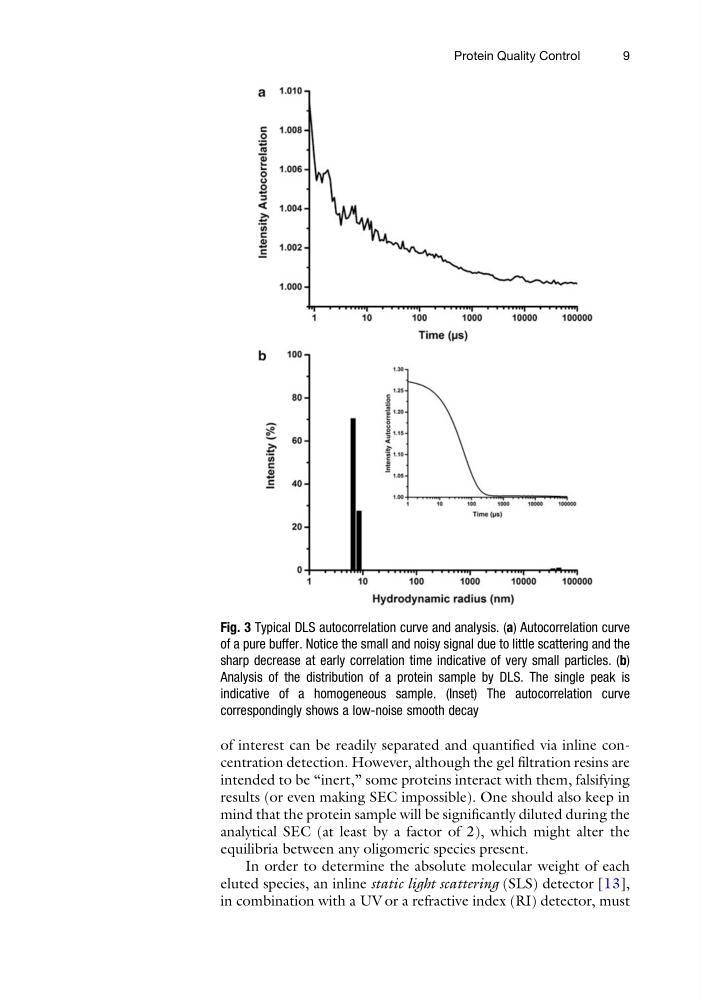
Fig. 3 Typical DLS autocorrelation curve and analysis. (a) Autocorrelation curve
of a pure buffer. Notice the small and noisy signal due to little scattering and the
sharp decrease at early correlation time indicative of very small particles. (b)
Analysis of the distribution of a protein sample by DLS. The single peak is
indicative of a homogeneous sample. (Inset) The autocorrelation curve
correspondingly shows a low-noise smooth decay
Protein Quality Control
9
intended to be “inert,” some proteins interact with them, falsifying
results (or even making SEC impossible). One should also keep in
mind that the protein sample will be significantly diluted during the
analytical SEC (at least by a factor of 2), which might alter the
equilibria between any oligomeric species present.
In order to determine the absolute molecular weight of each
eluted species, an inline static light scattering (SLS) detector [13],
in combination with a UV or a refractive index (RI) detector, must
Fig. 3 Typical DLS autocorrelation curve and analysis. (a) Autocorrelation curve
of a pure buffer. Notice the small and noisy signal due to little scattering and the
sharp decrease at early correlation time indicative of very small particles. (b)
Analysis of the distribution of a protein sample by DLS. The single peak is
indicative of a homogeneous sample. (Inset) The autocorrelation curve
correspondingly shows a low-noise smooth decay
Protein Quality Control
9