

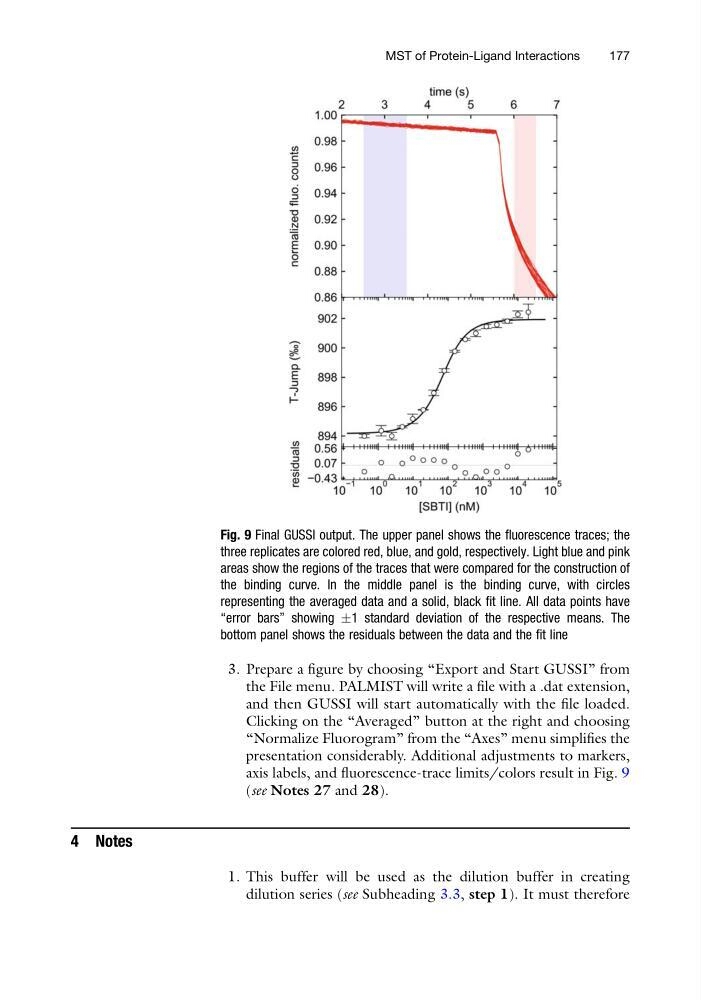
3. Prepare a figure by choosing “Export and Start GUSSI” from
the File menu. PALMIST will write a file with a .dat extension,
and then GUSSI will start automatically with the file loaded.
Clicking on the “Averaged” button at the right and choosing
“Normalize Fluorogram” from the “Axes” menu simplifies the
presentation considerably. Additional adjustments to markers,
axis labels, and fluorescence-trace limits/colors result in Fig. 9
(see Notes 27 and 28).
4 Notes
1. This buffer will be used as the dilution buffer in creating
dilution series (see Subheading 3.3, step 1). It must therefore
Fig. 9 Final GUSSI output. The upper panel shows the fluorescence traces; the
three replicates are colored red, blue, and gold, respectively. Light blue and pink
areas show the regions of the traces that were compared for the construction of
the binding curve. In the middle panel is the binding curve, with circles
representing the averaged data and a solid, black fit line. All data points have
“error bars” showing Æ1 standard deviation of the respective means. The
bottom panel shows the residuals between the data and the fit line
MST of Protein-Ligand Interactions
177
the File menu. PALMIST will write a file with a .dat extension,
and then GUSSI will start automatically with the file loaded.
Clicking on the “Averaged” button at the right and choosing
“Normalize Fluorogram” from the “Axes” menu simplifies the
presentation considerably. Additional adjustments to markers,
axis labels, and fluorescence-trace limits/colors result in Fig. 9
(see Notes 27 and 28).
4 Notes
1. This buffer will be used as the dilution buffer in creating
dilution series (see Subheading 3.3, step 1). It must therefore
Fig. 9 Final GUSSI output. The upper panel shows the fluorescence traces; the
three replicates are colored red, blue, and gold, respectively. Light blue and pink
areas show the regions of the traces that were compared for the construction of
the binding curve. In the middle panel is the binding curve, with circles
representing the averaged data and a solid, black fit line. All data points have
“error bars” showing Æ1 standard deviation of the respective means. The
bottom panel shows the residuals between the data and the fit line
MST of Protein-Ligand Interactions
177