

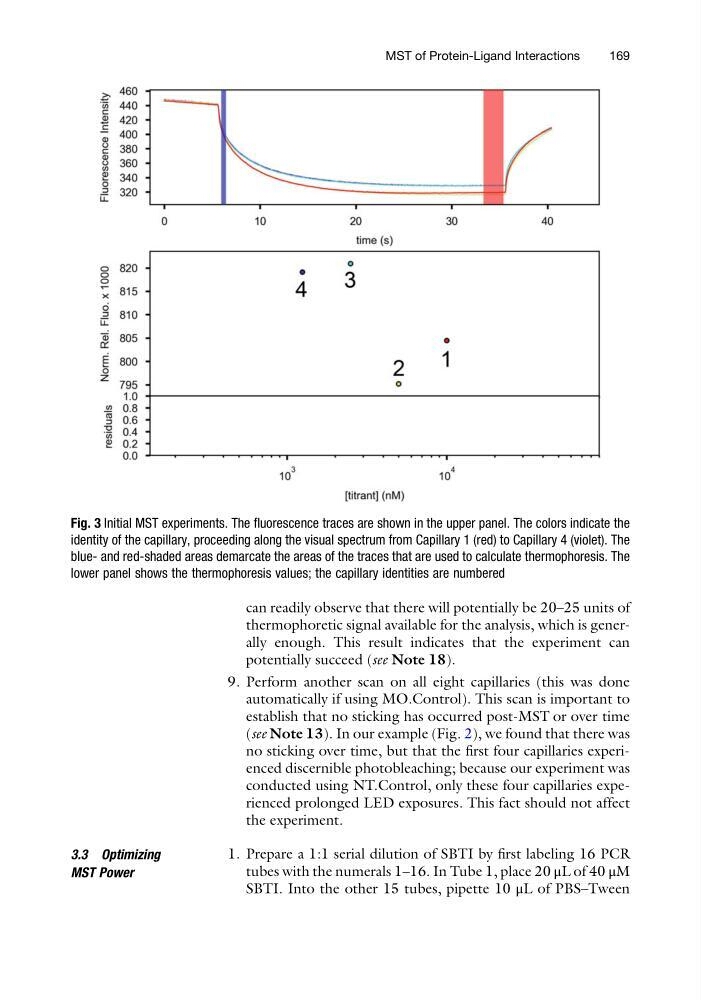
can readily observe that there will potentially be 20–25 units of
thermophoretic signal available for the analysis, which is generally enough. This result indicates that the experiment can
potentially succeed (see Note 18).
9. Perform another scan on all eight capillaries (this was done
automatically if using MO.Control). This scan is important to
establish that no sticking has occurred post-MST or over time
(see Note 13). In our example (Fig. 2), we found that there was
no sticking over time, but that the first four capillaries experienced discernible photobleaching; because our experiment was
conducted using NT.Control, only these four capillaries experienced prolonged LED exposures. This fact should not affect
the experiment.
3.3 Optimizing
MST Power
1. Prepare a 1:1 serial dilution of SBTI by first labeling 16 PCR
tubes with the numerals 1–16. In Tube 1, place 20 μL of 40 μM
SBTI. Into the other 15 tubes, pipette 10 μL of PBS–Tween
Fig. 3 Initial MST experiments. The fluorescence traces are shown in the upper panel. The colors indicate the
identity of the capillary, proceeding along the visual spectrum from Capillary 1 (red) to Capillary 4 (violet). The
blue- and red-shaded areas demarcate the areas of the traces that are used to calculate thermophoresis. The
lower panel shows the thermophoresis values; the capillary identities are numbered
MST of Protein-Ligand Interactions
169
thermophoretic signal available for the analysis, which is generally enough. This result indicates that the experiment can
potentially succeed (see Note 18).
9. Perform another scan on all eight capillaries (this was done
automatically if using MO.Control). This scan is important to
establish that no sticking has occurred post-MST or over time
(see Note 13). In our example (Fig. 2), we found that there was
no sticking over time, but that the first four capillaries experienced discernible photobleaching; because our experiment was
conducted using NT.Control, only these four capillaries experienced prolonged LED exposures. This fact should not affect
the experiment.
3.3 Optimizing
MST Power
1. Prepare a 1:1 serial dilution of SBTI by first labeling 16 PCR
tubes with the numerals 1–16. In Tube 1, place 20 μL of 40 μM
SBTI. Into the other 15 tubes, pipette 10 μL of PBS–Tween
Fig. 3 Initial MST experiments. The fluorescence traces are shown in the upper panel. The colors indicate the
identity of the capillary, proceeding along the visual spectrum from Capillary 1 (red) to Capillary 4 (violet). The
blue- and red-shaded areas demarcate the areas of the traces that are used to calculate thermophoresis. The
lower panel shows the thermophoresis values; the capillary identities are numbered
MST of Protein-Ligand Interactions
169