

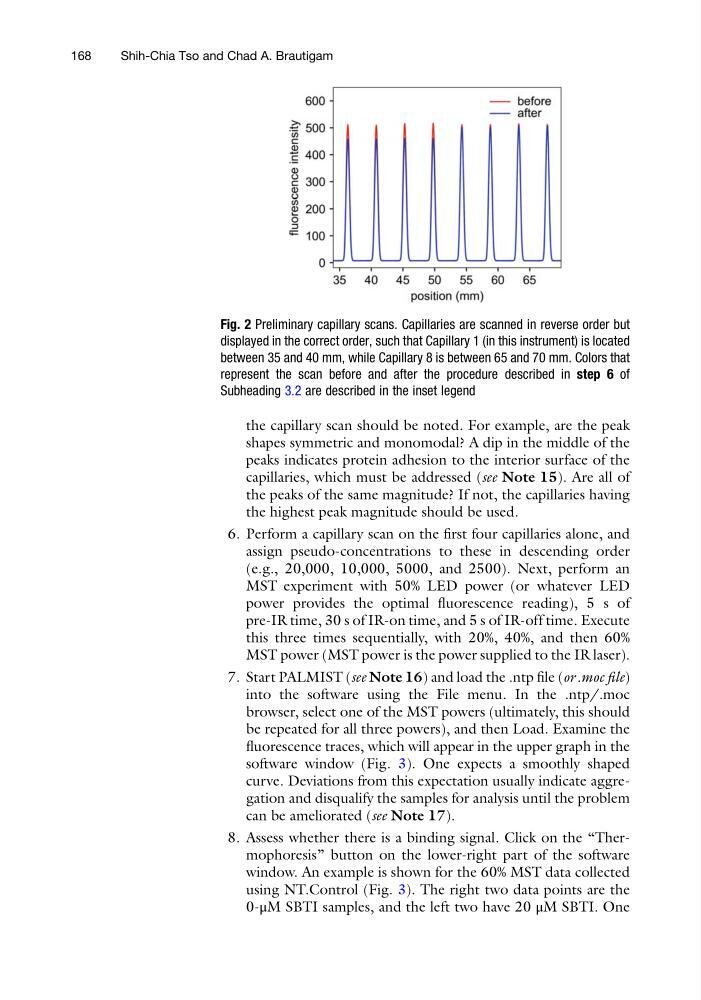
the capillary scan should be noted. For example, are the peak
shapes symmetric and monomodal? A dip in the middle of the
peaks indicates protein adhesion to the interior surface of the
capillaries, which must be addressed (see Note 15). Are all of
the peaks of the same magnitude? If not, the capillaries having
the highest peak magnitude should be used.
6. Perform a capillary scan on the first four capillaries alone, and
assign pseudo-concentrations to these in descending order
(e.g., 20,000, 10,000, 5000, and 2500). Next, perform an
MST experiment with 50% LED power (or whatever LED
power provides the optimal fluorescence reading), 5 s of
pre-IR time, 30 s of IR-on time, and 5 s of IR-off time. Execute
this three times sequentially, with 20%, 40%, and then 60%
MST power (MST power is the power supplied to the IR laser).
7. Start PALMIST (see Note 16) and load the .ntp file (or .moc file)
into the software using the File menu. In the .ntp/.moc
browser, select one of the MST powers (ultimately, this should
be repeated for all three powers), and then Load. Examine the
fluorescence traces, which will appear in the upper graph in the
software window (Fig. 3). One expects a smoothly shaped
curve. Deviations from this expectation usually indicate aggregation and disqualify the samples for analysis until the problem
can be ameliorated (see Note 17).
8. Assess whether there is a binding signal. Click on the “Thermophoresis” button on the lower-right part of the software
window. An example is shown for the 60% MST data collected
using NT.Control (Fig. 3). The right two data points are the
0-μM SBTI samples, and the left two have 20 μM SBTI. One
Fig. 2 Preliminary capillary scans. Capillaries are scanned in reverse order but
displayed in the correct order, such that Capillary 1 (in this instrument) is located
between 35 and 40 mm, while Capillary 8 is between 65 and 70 mm. Colors that
represent the scan before and after the procedure described in step 6 of
Subheading 3.2 are described in the inset legend
168
Shih-Chia Tso and Chad A. Brautigam
shapes symmetric and monomodal? A dip in the middle of the
peaks indicates protein adhesion to the interior surface of the
capillaries, which must be addressed (see Note 15). Are all of
the peaks of the same magnitude? If not, the capillaries having
the highest peak magnitude should be used.
6. Perform a capillary scan on the first four capillaries alone, and
assign pseudo-concentrations to these in descending order
(e.g., 20,000, 10,000, 5000, and 2500). Next, perform an
MST experiment with 50% LED power (or whatever LED
power provides the optimal fluorescence reading), 5 s of
pre-IR time, 30 s of IR-on time, and 5 s of IR-off time. Execute
this three times sequentially, with 20%, 40%, and then 60%
MST power (MST power is the power supplied to the IR laser).
7. Start PALMIST (see Note 16) and load the .ntp file (or .moc file)
into the software using the File menu. In the .ntp/.moc
browser, select one of the MST powers (ultimately, this should
be repeated for all three powers), and then Load. Examine the
fluorescence traces, which will appear in the upper graph in the
software window (Fig. 3). One expects a smoothly shaped
curve. Deviations from this expectation usually indicate aggregation and disqualify the samples for analysis until the problem
can be ameliorated (see Note 17).
8. Assess whether there is a binding signal. Click on the “Thermophoresis” button on the lower-right part of the software
window. An example is shown for the 60% MST data collected
using NT.Control (Fig. 3). The right two data points are the
0-μM SBTI samples, and the left two have 20 μM SBTI. One
Fig. 2 Preliminary capillary scans. Capillaries are scanned in reverse order but
displayed in the correct order, such that Capillary 1 (in this instrument) is located
between 35 and 40 mm, while Capillary 8 is between 65 and 70 mm. Colors that
represent the scan before and after the procedure described in step 6 of
Subheading 3.2 are described in the inset legend
168
Shih-Chia Tso and Chad A. Brautigam