

capillary tube, manifesting as a diminution in fluorescence. Because
the net observed thermophoresis is expected to be linearly dependent on the liganded state of the receptor, this characteristic can be
monitored over many capillaries having different concentrations of
the ligand, and these signals can be transformed into a binding
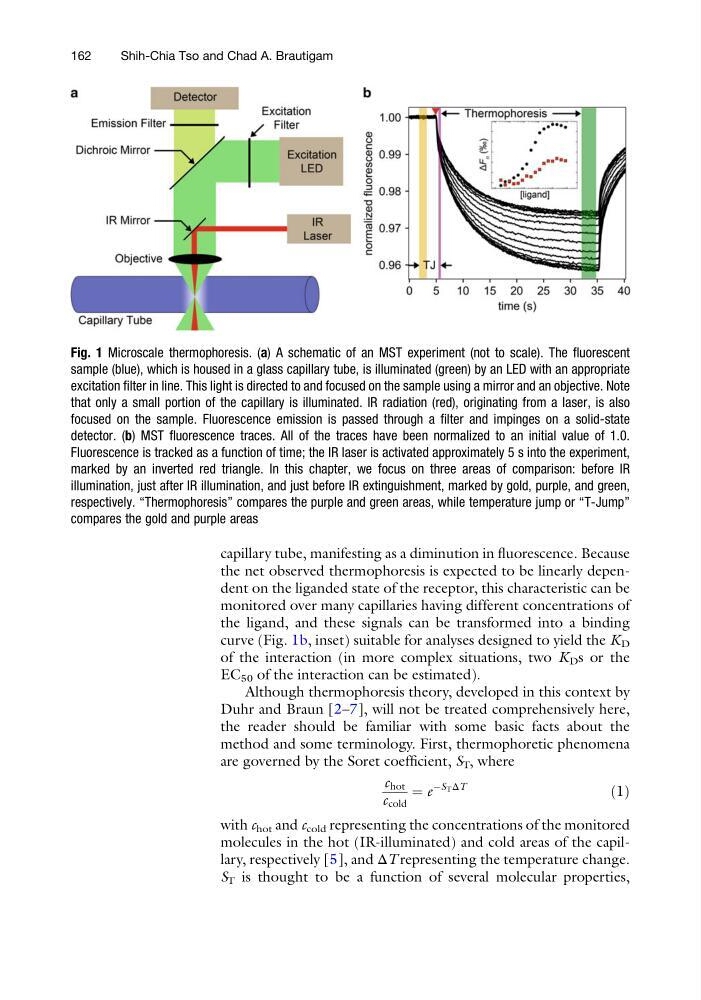
curve (Fig. 1b, inset) suitable for analyses designed to yield the K D
of the interaction (in more complex situations, two K D s or the
EC 50 of the interaction can be estimated).
Although thermophoresis theory, developed in this context by
Duhr and Braun [2–7], will not be treated comprehensively here,
the reader should be familiar with some basic facts about the
method and some terminology. First, thermophoretic phenomena
are governed by the Soret coefficient, S T , where
c hot
c cold
¼ e
ÀS T ΔT
ð1Þ
with c hot and c cold representing the concentrations of the monitored
molecules in the hot (IR-illuminated) and cold areas of the capillary, respectively [5], and ΔT representing the temperature change.
S T is thought to be a function of several molecular properties,
Fig. 1 Microscale thermophoresis. (a) A schematic of an MST experiment (not to scale). The fluorescent
sample (blue), which is housed in a glass capillary tube, is illuminated (green) by an LED with an appropriate
excitation filter in line. This light is directed to and focused on the sample using a mirror and an objective. Note
that only a small portion of the capillary is illuminated. IR radiation (red), originating from a laser, is also
focused on the sample. Fluorescence emission is passed through a filter and impinges on a solid-state
detector. (b) MST fluorescence traces. All of the traces have been normalized to an initial value of 1.0.
Fluorescence is tracked as a function of time; the IR laser is activated approximately 5 s into the experiment,
marked by an inverted red triangle. In this chapter, we focus on three areas of comparison: before IR
illumination, just after IR illumination, and just before IR extinguishment, marked by gold, purple, and green,
respectively. “Thermophoresis” compares the purple and green areas, while temperature jump or “T-Jump”
compares the gold and purple areas
162
Shih-Chia Tso and Chad A. Brautigam
the net observed thermophoresis is expected to be linearly dependent on the liganded state of the receptor, this characteristic can be
monitored over many capillaries having different concentrations of
the ligand, and these signals can be transformed into a binding
curve (Fig. 1b, inset) suitable for analyses designed to yield the K D
of the interaction (in more complex situations, two K D s or the
EC 50 of the interaction can be estimated).
Although thermophoresis theory, developed in this context by
Duhr and Braun [2–7], will not be treated comprehensively here,
the reader should be familiar with some basic facts about the
method and some terminology. First, thermophoretic phenomena
are governed by the Soret coefficient, S T , where
c hot
c cold
¼ e
ÀS T ΔT
ð1Þ
with c hot and c cold representing the concentrations of the monitored
molecules in the hot (IR-illuminated) and cold areas of the capillary, respectively [5], and ΔT representing the temperature change.
S T is thought to be a function of several molecular properties,
Fig. 1 Microscale thermophoresis. (a) A schematic of an MST experiment (not to scale). The fluorescent
sample (blue), which is housed in a glass capillary tube, is illuminated (green) by an LED with an appropriate
excitation filter in line. This light is directed to and focused on the sample using a mirror and an objective. Note
that only a small portion of the capillary is illuminated. IR radiation (red), originating from a laser, is also
focused on the sample. Fluorescence emission is passed through a filter and impinges on a solid-state
detector. (b) MST fluorescence traces. All of the traces have been normalized to an initial value of 1.0.
Fluorescence is tracked as a function of time; the IR laser is activated approximately 5 s into the experiment,
marked by an inverted red triangle. In this chapter, we focus on three areas of comparison: before IR
illumination, just after IR illumination, and just before IR extinguishment, marked by gold, purple, and green,
respectively. “Thermophoresis” compares the purple and green areas, while temperature jump or “T-Jump”
compares the gold and purple areas
162
Shih-Chia Tso and Chad A. Brautigam