

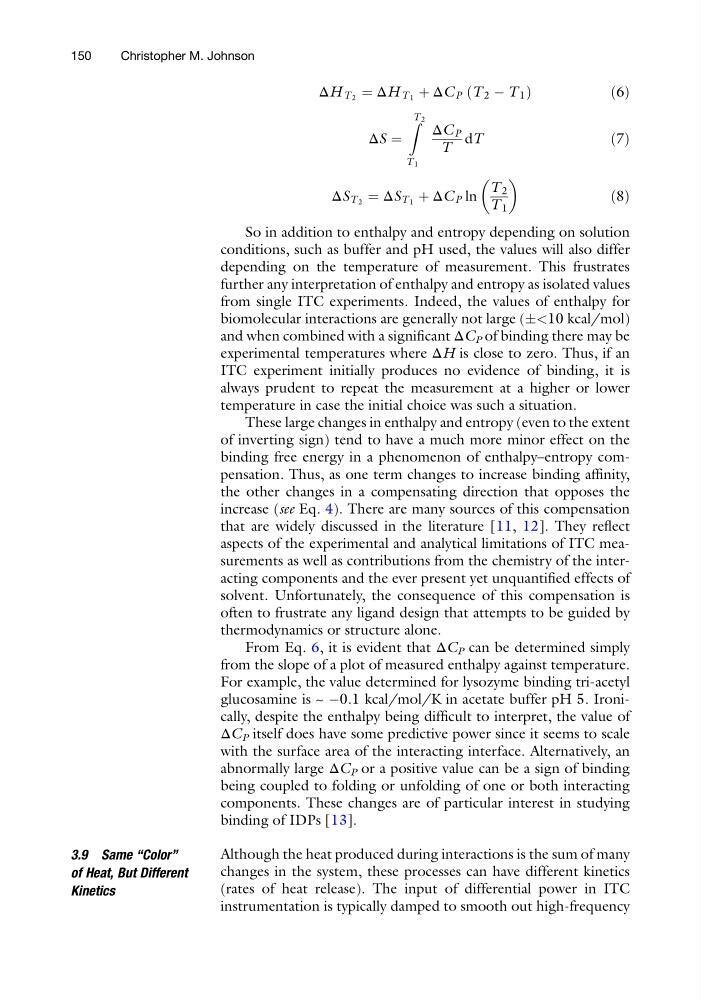
ΔH T 2 ¼ ΔH T 1 þ ΔC P T 2 À T 1
ð
Þ
ð 6Þ
ΔS ¼
Z T 2
T 1
ΔC P
T
dT
ð7Þ
ΔS T 2 ¼ ΔS T 1 þ ΔC P ln
T 2
T 1
ð8Þ
So in addition to enthalpy and entropy depending on solution
conditions, such as buffer and pH used, the values will also differ
depending on the temperature of measurement. This frustrates
further any interpretation of enthalpy and entropy as isolated values
from single ITC experiments. Indeed, the values of enthalpy for
biomolecular interactions are generally not large (Æ<10 kcal/mol)
and when combined with a significant ΔC P of binding there may be
experimental temperatures where ΔH is close to zero. Thus, if an
ITC experiment initially produces no evidence of binding, it is
always prudent to repeat the measurement at a higher or lower
temperature in case the initial choice was such a situation.
These large changes in enthalpy and entropy (even to the extent
of inverting sign) tend to have a much more minor effect on the
binding free energy in a phenomenon of enthalpy–entropy compensation. Thus, as one term changes to increase binding affinity,
the other changes in a compensating direction that opposes the
increase (see Eq. 4). There are many sources of this compensation
that are widely discussed in the literature [11, 12]. They reflect
aspects of the experimental and analytical limitations of ITC measurements as well as contributions from the chemistry of the interacting components and the ever present yet unquantified effects of
solvent. Unfortunately, the consequence of this compensation is
often to frustrate any ligand design that attempts to be guided by
thermodynamics or structure alone.
From Eq. 6, it is evident that ΔC P can be determined simply
from the slope of a plot of measured enthalpy against temperature.
For example, the value determined for lysozyme binding tri-acetyl
glucosamine is ~ À0.1 kcal/mol/K in acetate buffer pH 5. Ironically, despite the enthalpy being difficult to interpret, the value of
ΔC P itself does have some predictive power since it seems to scale
with the surface area of the interacting interface. Alternatively, an
abnormally large ΔC P or a positive value can be a sign of binding
being coupled to folding or unfolding of one or both interacting
components. These changes are of particular interest in studying
binding of IDPs [13].
3.9 Same “Color”
of Heat, But Different
Kinetics
Although the heat produced during interactions is the sum of many
changes in the system, these processes can have different kinetics
(rates of heat release). The input of differential power in ITC
instrumentation is typically damped to smooth out high-frequency
150
Christopher M. Johnson
ð
Þ
ð 6Þ
ΔS ¼
Z T 2
T 1
ΔC P
T
dT
ð7Þ
ΔS T 2 ¼ ΔS T 1 þ ΔC P ln
T 2
T 1
ð8Þ
So in addition to enthalpy and entropy depending on solution
conditions, such as buffer and pH used, the values will also differ
depending on the temperature of measurement. This frustrates
further any interpretation of enthalpy and entropy as isolated values
from single ITC experiments. Indeed, the values of enthalpy for
biomolecular interactions are generally not large (Æ<10 kcal/mol)
and when combined with a significant ΔC P of binding there may be
experimental temperatures where ΔH is close to zero. Thus, if an
ITC experiment initially produces no evidence of binding, it is
always prudent to repeat the measurement at a higher or lower
temperature in case the initial choice was such a situation.
These large changes in enthalpy and entropy (even to the extent
of inverting sign) tend to have a much more minor effect on the
binding free energy in a phenomenon of enthalpy–entropy compensation. Thus, as one term changes to increase binding affinity,
the other changes in a compensating direction that opposes the
increase (see Eq. 4). There are many sources of this compensation
that are widely discussed in the literature [11, 12]. They reflect
aspects of the experimental and analytical limitations of ITC measurements as well as contributions from the chemistry of the interacting components and the ever present yet unquantified effects of
solvent. Unfortunately, the consequence of this compensation is
often to frustrate any ligand design that attempts to be guided by
thermodynamics or structure alone.
From Eq. 6, it is evident that ΔC P can be determined simply
from the slope of a plot of measured enthalpy against temperature.
For example, the value determined for lysozyme binding tri-acetyl
glucosamine is ~ À0.1 kcal/mol/K in acetate buffer pH 5. Ironically, despite the enthalpy being difficult to interpret, the value of
ΔC P itself does have some predictive power since it seems to scale
with the surface area of the interacting interface. Alternatively, an
abnormally large ΔC P or a positive value can be a sign of binding
being coupled to folding or unfolding of one or both interacting
components. These changes are of particular interest in studying
binding of IDPs [13].
3.9 Same “Color”
of Heat, But Different
Kinetics
Although the heat produced during interactions is the sum of many
changes in the system, these processes can have different kinetics
(rates of heat release). The input of differential power in ITC
instrumentation is typically damped to smooth out high-frequency
150
Christopher M. Johnson