

TRI Releases (millions of pounds)
0
500
1,000
1,500
2,000
2,500
3,000
1988 1989 1990 1991 1992 1993 1994 1995 1996 1997 1998 1999 2000 2001 2002 2003 2004
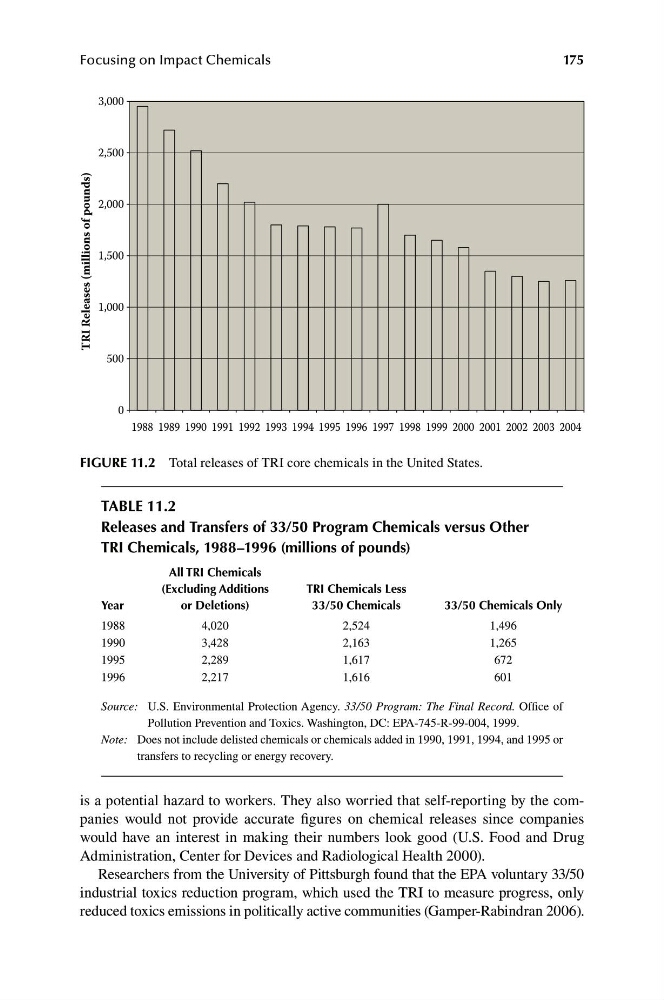
FIGURE 11.2 Total releases of TRI core chemicals in the United States.
175
Focusing on Impact Chemicals
TABLE 11.2
Releases and Transfers of 33/50 Program Chemicals versus Other
TRI Chemicals, 1988–1996 (millions of pounds)
All TRI Chemicals
(Excluding Additions
TRI Chemicals Less
Year
or Deletions)
33/50 Chemicals
33/50 Chemicals Only
1988
4,020
2,524
1,496
1990
3,428
2,163
1,265
1995
2,289
1,617
672
1996
2,217
1,616
601
Source: U.S. Environmental Protection Agency. 33/50 Program: The Final Record. Office of
Pollution Prevention and Toxics. Washington, DC: EPA-745-R-99-004, 1999.
Note: Does not include delisted chemicals or chemicals added in 1990, 1991, 1994, and 1995 or
transfers to recycling or energy recovery.
is a potential hazard to workers. They also worried that self-reporting by the companies would not provide accurate figures on chemical releases since companies
would have an interest in making their numbers look good (U.S. Food and Drug
Administration, Center for Devices and Radiological Health 2000).
Researchers from the University of Pittsburgh found that the EPA voluntary 33/50
industrial toxics reduction program, which used the TRI to measure progress, only
reduced toxics emissions in politically active communities (Gamper-Rabindran 2006).
0
500
1,000
1,500
2,000
2,500
3,000
1988 1989 1990 1991 1992 1993 1994 1995 1996 1997 1998 1999 2000 2001 2002 2003 2004
FIGURE 11.2 Total releases of TRI core chemicals in the United States.
175
Focusing on Impact Chemicals
TABLE 11.2
Releases and Transfers of 33/50 Program Chemicals versus Other
TRI Chemicals, 1988–1996 (millions of pounds)
All TRI Chemicals
(Excluding Additions
TRI Chemicals Less
Year
or Deletions)
33/50 Chemicals
33/50 Chemicals Only
1988
4,020
2,524
1,496
1990
3,428
2,163
1,265
1995
2,289
1,617
672
1996
2,217
1,616
601
Source: U.S. Environmental Protection Agency. 33/50 Program: The Final Record. Office of
Pollution Prevention and Toxics. Washington, DC: EPA-745-R-99-004, 1999.
Note: Does not include delisted chemicals or chemicals added in 1990, 1991, 1994, and 1995 or
transfers to recycling or energy recovery.
is a potential hazard to workers. They also worried that self-reporting by the companies would not provide accurate figures on chemical releases since companies
would have an interest in making their numbers look good (U.S. Food and Drug
Administration, Center for Devices and Radiological Health 2000).
Researchers from the University of Pittsburgh found that the EPA voluntary 33/50
industrial toxics reduction program, which used the TRI to measure progress, only
reduced toxics emissions in politically active communities (Gamper-Rabindran 2006).