

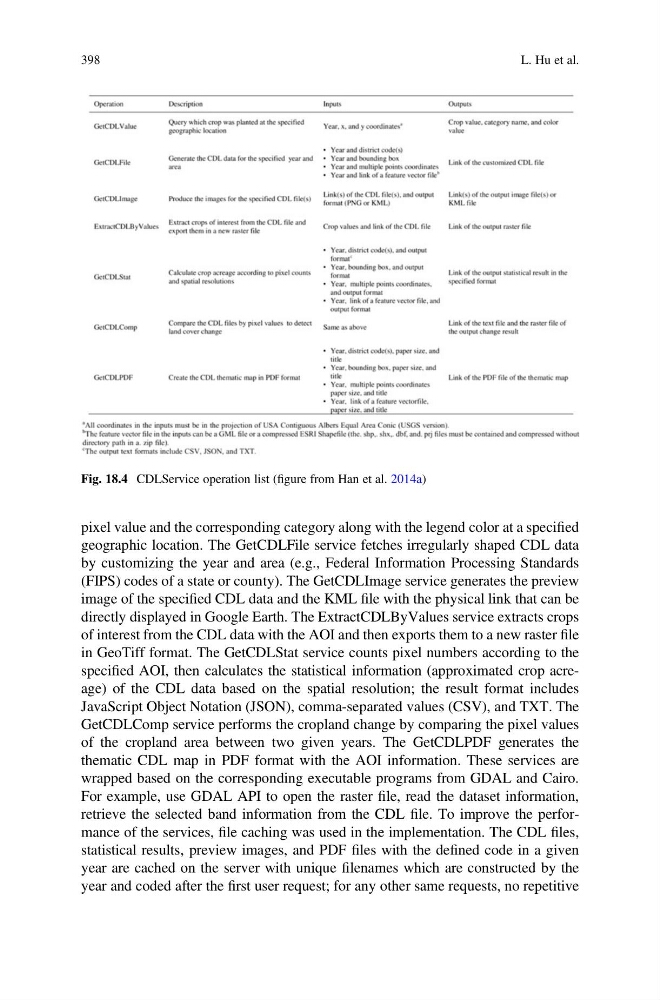
pixel value and the corresponding category along with the legend color at a specified
geographic location. The GetCDLFile service fetches irregularly shaped CDL data
by customizing the year and area (e.g., Federal Information Processing Standards
(FIPS) codes of a state or county). The GetCDLImage service generates the preview
image of the specified CDL data and the KML file with the physical link that can be
directly displayed in Google Earth. The ExtractCDLByValues service extracts crops
of interest from the CDL data with the AOI and then exports them to a new raster file
in GeoTiff format. The GetCDLStat service counts pixel numbers according to the
specified AOI, then calculates the statistical information (approximated crop acreage) of the CDL data based on the spatial resolution; the result format includes
JavaScript Object Notation (JSON), comma-separated values (CSV), and TXT. The
GetCDLComp service performs the cropland change by comparing the pixel values
of the cropland area between two given years. The GetCDLPDF generates the
thematic CDL map in PDF format with the AOI information. These services are
wrapped based on the corresponding executable programs from GDAL and Cairo.
For example, use GDAL API to open the raster file, read the dataset information,
retrieve the selected band information from the CDL file. To improve the performance of the services, file caching was used in the implementation. The CDL files,
statistical results, preview images, and PDF files with the defined code in a given
year are cached on the server with unique filenames which are constructed by the
year and coded after the first user request; for any other same requests, no repetitive
Fig. 18.4 CDLService operation list (figure from Han et al. 2014a)
398
L. Hu et al.
geographic location. The GetCDLFile service fetches irregularly shaped CDL data
by customizing the year and area (e.g., Federal Information Processing Standards
(FIPS) codes of a state or county). The GetCDLImage service generates the preview
image of the specified CDL data and the KML file with the physical link that can be
directly displayed in Google Earth. The ExtractCDLByValues service extracts crops
of interest from the CDL data with the AOI and then exports them to a new raster file
in GeoTiff format. The GetCDLStat service counts pixel numbers according to the
specified AOI, then calculates the statistical information (approximated crop acreage) of the CDL data based on the spatial resolution; the result format includes
JavaScript Object Notation (JSON), comma-separated values (CSV), and TXT. The
GetCDLComp service performs the cropland change by comparing the pixel values
of the cropland area between two given years. The GetCDLPDF generates the
thematic CDL map in PDF format with the AOI information. These services are
wrapped based on the corresponding executable programs from GDAL and Cairo.
For example, use GDAL API to open the raster file, read the dataset information,
retrieve the selected band information from the CDL file. To improve the performance of the services, file caching was used in the implementation. The CDL files,
statistical results, preview images, and PDF files with the defined code in a given
year are cached on the server with unique filenames which are constructed by the
year and coded after the first user request; for any other same requests, no repetitive
Fig. 18.4 CDLService operation list (figure from Han et al. 2014a)
398
L. Hu et al.