

the ensured consistency in units, spatial/temporal scales, ownership and copyright,
data interpretation, etc. to enable easy dissemination of data (Janssen et al. 2009).
Many efforts have been made in different application domains to integrate various
data sources together. Hutchinson et al. (1996) developed a gridded topographic and
mean monthly climatic database for the Africa continent. Gobin et al. (2004)
connected different data sources to assess the indicators of soil erosion on the
European scale. Herrero et al. (2007) developed a household-level database about
the crop-livestock systems in developing countries.
Many projects have been initiated to develop spatially distributed databases at the
national level or even continental or global sale. For example, the first and largest
soil database, NSCD (National Soil Characterization Database) in the United States,
was produced and updated by the US Department of Agriculture (USDA 1994). This
database descripts more than 5000 soil profiles within the United States. The State
Soil Geographic (STATSGO) and Soil Survey Geographic (SSURGO) are two soil
database, providing the soil input for farm and ranch, landowner/user, township,
county, and natural planning and management at farm level (STATSGO) and county
level (SSURGO) (Wang and Mellesse 2006). The World Inventory of Soil Emission
of Potential Database (WISE) compiled soil profiles from 69 countries from the
Americas, Asia, Africa, Australia, etc. (Batjes 1995). The INSPIRES initiative of the
European Commission (INSPIRES 2008) tried to develop a European spatial information infrastructure that can improve the availability and interoperability of spatial
data across the entire Europe so that these datasets can be reused easily for policy
assessments.
The development of new digital databases has not progressed as quickly as the
generation of spatial data and needs to keep being updated in a timely manner. There
are conceptual and technical differences that hinder the integration of various data
sources together from different application domains. These barriers includes the
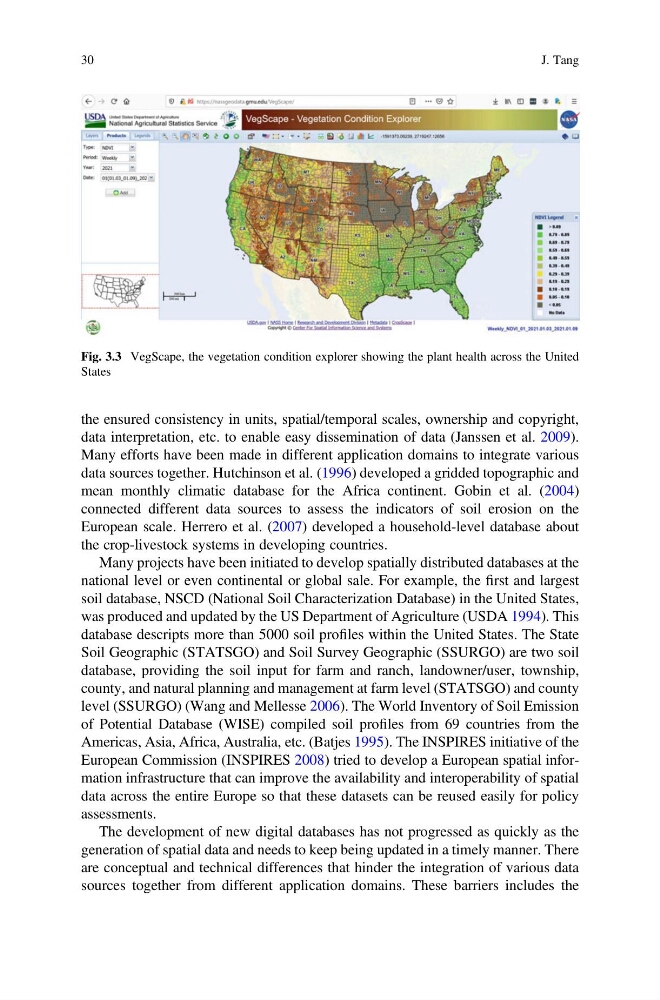
Fig. 3.3 VegScape, the vegetation condition explorer showing the plant health across the United
States
30
J. Tang
data interpretation, etc. to enable easy dissemination of data (Janssen et al. 2009).
Many efforts have been made in different application domains to integrate various
data sources together. Hutchinson et al. (1996) developed a gridded topographic and
mean monthly climatic database for the Africa continent. Gobin et al. (2004)
connected different data sources to assess the indicators of soil erosion on the
European scale. Herrero et al. (2007) developed a household-level database about
the crop-livestock systems in developing countries.
Many projects have been initiated to develop spatially distributed databases at the
national level or even continental or global sale. For example, the first and largest
soil database, NSCD (National Soil Characterization Database) in the United States,
was produced and updated by the US Department of Agriculture (USDA 1994). This
database descripts more than 5000 soil profiles within the United States. The State
Soil Geographic (STATSGO) and Soil Survey Geographic (SSURGO) are two soil
database, providing the soil input for farm and ranch, landowner/user, township,
county, and natural planning and management at farm level (STATSGO) and county
level (SSURGO) (Wang and Mellesse 2006). The World Inventory of Soil Emission
of Potential Database (WISE) compiled soil profiles from 69 countries from the
Americas, Asia, Africa, Australia, etc. (Batjes 1995). The INSPIRES initiative of the
European Commission (INSPIRES 2008) tried to develop a European spatial information infrastructure that can improve the availability and interoperability of spatial
data across the entire Europe so that these datasets can be reused easily for policy
assessments.
The development of new digital databases has not progressed as quickly as the
generation of spatial data and needs to keep being updated in a timely manner. There
are conceptual and technical differences that hinder the integration of various data
sources together from different application domains. These barriers includes the
Fig. 3.3 VegScape, the vegetation condition explorer showing the plant health across the United
States
30
J. Tang