

remarkable challenge and tremendous opportunities for the GIS and agricultural
communities.
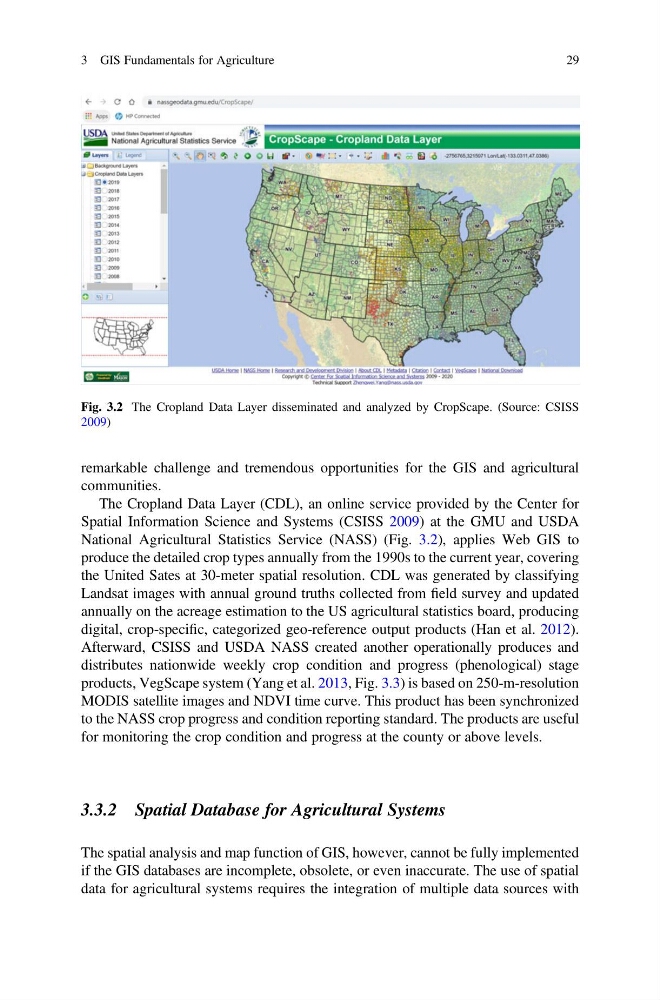
The Cropland Data Layer (CDL), an online service provided by the Center for
Spatial Information Science and Systems (CSISS 2009) at the GMU and USDA
National Agricultural Statistics Service (NASS) (Fig. 3.2), applies Web GIS to
produce the detailed crop types annually from the 1990s to the current year, covering
the United Sates at 30-meter spatial resolution. CDL was generated by classifying
Landsat images with annual ground truths collected from field survey and updated
annually on the acreage estimation to the US agricultural statistics board, producing
digital, crop-specific, categorized geo-reference output products (Han et al. 2012).
Afterward, CSISS and USDA NASS created another operationally produces and
distributes nationwide weekly crop condition and progress (phenological) stage
products, VegScape system (Yang et al. 2013, Fig. 3.3) is based on 250-m-resolution
MODIS satellite images and NDVI time curve. This product has been synchronized
to the NASS crop progress and condition reporting standard. The products are useful
for monitoring the crop condition and progress at the county or above levels.
3.3.2 Spatial Database for Agricultural Systems
The spatial analysis and map function of GIS, however, cannot be fully implemented
if the GIS databases are incomplete, obsolete, or even inaccurate. The use of spatial
data for agricultural systems requires the integration of multiple data sources with
Fig. 3.2 The Cropland Data Layer disseminated and analyzed by CropScape. (Source: CSISS
2009)
3 GIS Fundamentals for Agriculture
29
communities.
The Cropland Data Layer (CDL), an online service provided by the Center for
Spatial Information Science and Systems (CSISS 2009) at the GMU and USDA
National Agricultural Statistics Service (NASS) (Fig. 3.2), applies Web GIS to
produce the detailed crop types annually from the 1990s to the current year, covering
the United Sates at 30-meter spatial resolution. CDL was generated by classifying
Landsat images with annual ground truths collected from field survey and updated
annually on the acreage estimation to the US agricultural statistics board, producing
digital, crop-specific, categorized geo-reference output products (Han et al. 2012).
Afterward, CSISS and USDA NASS created another operationally produces and
distributes nationwide weekly crop condition and progress (phenological) stage
products, VegScape system (Yang et al. 2013, Fig. 3.3) is based on 250-m-resolution
MODIS satellite images and NDVI time curve. This product has been synchronized
to the NASS crop progress and condition reporting standard. The products are useful
for monitoring the crop condition and progress at the county or above levels.
3.3.2 Spatial Database for Agricultural Systems
The spatial analysis and map function of GIS, however, cannot be fully implemented
if the GIS databases are incomplete, obsolete, or even inaccurate. The use of spatial
data for agricultural systems requires the integration of multiple data sources with
Fig. 3.2 The Cropland Data Layer disseminated and analyzed by CropScape. (Source: CSISS
2009)
3 GIS Fundamentals for Agriculture
29