

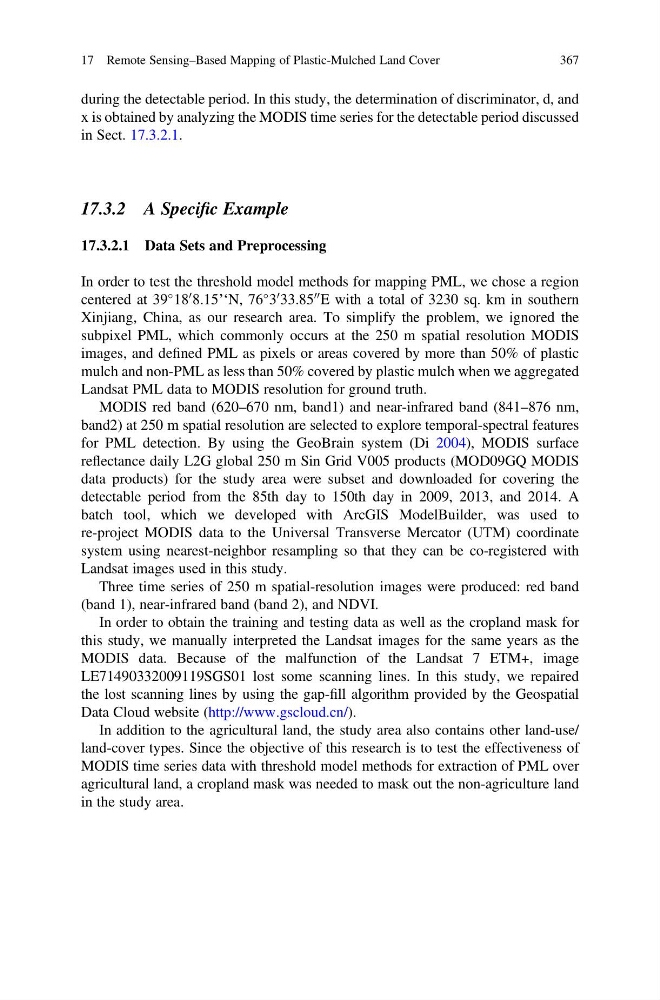
during the detectable period. In this study, the determination of discriminator, d, and
x is obtained by analyzing the MODIS time series for the detectable period discussed
in Sect. 17.3.2.1.
17.3.2 A Specific Example
17.3.2.1 Data Sets and Preprocessing
In order to test the threshold model methods for mapping PML, we chose a region
centered at 39
18
0 8.15’‘N, 76
3
0 33.85
00 E with a total of 3230 sq. km in southern
Xinjiang, China, as our research area. To simplify the problem, we ignored the
subpixel PML, which commonly occurs at the 250 m spatial resolution MODIS
images, and defined PML as pixels or areas covered by more than 50% of plastic
mulch and non-PML as less than 50% covered by plastic mulch when we aggregated
Landsat PML data to MODIS resolution for ground truth.
MODIS red band (620–670 nm, band1) and near-infrared band (841–876 nm,
band2) at 250 m spatial resolution are selected to explore temporal-spectral features
for PML detection. By using the GeoBrain system (Di 2004), MODIS surface
reflectance daily L2G global 250 m Sin Grid V005 products (MOD09GQ MODIS
data products) for the study area were subset and downloaded for covering the
detectable period from the 85th day to 150th day in 2009, 2013, and 2014. A
batch tool, which we developed with ArcGIS ModelBuilder, was used to
re-project MODIS data to the Universal Transverse Mercator (UTM) coordinate
system using nearest-neighbor resampling so that they can be co-registered with
Landsat images used in this study.
Three time series of 250 m spatial-resolution images were produced: red band
(band 1), near-infrared band (band 2), and NDVI.
In order to obtain the training and testing data as well as the cropland mask for
this study, we manually interpreted the Landsat images for the same years as the
MODIS data. Because of the malfunction of the Landsat 7 ETM+, image
LE71490332009119SGS01 lost some scanning lines. In this study, we repaired
the lost scanning lines by using the gap-fill algorithm provided by the Geospatial
Data Cloud website (http://www.gscloud.cn/).
In addition to the agricultural land, the study area also contains other land-use/
land-cover types. Since the objective of this research is to test the effectiveness of
MODIS time series data with threshold model methods for extraction of PML over
agricultural land, a cropland mask was needed to mask out the non-agriculture land
in the study area.
17 Remote Sensing–Based Mapping of Plastic-Mulched Land Cover
367
x is obtained by analyzing the MODIS time series for the detectable period discussed
in Sect. 17.3.2.1.
17.3.2 A Specific Example
17.3.2.1 Data Sets and Preprocessing
In order to test the threshold model methods for mapping PML, we chose a region
centered at 39
18
0 8.15’‘N, 76
3
0 33.85
00 E with a total of 3230 sq. km in southern
Xinjiang, China, as our research area. To simplify the problem, we ignored the
subpixel PML, which commonly occurs at the 250 m spatial resolution MODIS
images, and defined PML as pixels or areas covered by more than 50% of plastic
mulch and non-PML as less than 50% covered by plastic mulch when we aggregated
Landsat PML data to MODIS resolution for ground truth.
MODIS red band (620–670 nm, band1) and near-infrared band (841–876 nm,
band2) at 250 m spatial resolution are selected to explore temporal-spectral features
for PML detection. By using the GeoBrain system (Di 2004), MODIS surface
reflectance daily L2G global 250 m Sin Grid V005 products (MOD09GQ MODIS
data products) for the study area were subset and downloaded for covering the
detectable period from the 85th day to 150th day in 2009, 2013, and 2014. A
batch tool, which we developed with ArcGIS ModelBuilder, was used to
re-project MODIS data to the Universal Transverse Mercator (UTM) coordinate
system using nearest-neighbor resampling so that they can be co-registered with
Landsat images used in this study.
Three time series of 250 m spatial-resolution images were produced: red band
(band 1), near-infrared band (band 2), and NDVI.
In order to obtain the training and testing data as well as the cropland mask for
this study, we manually interpreted the Landsat images for the same years as the
MODIS data. Because of the malfunction of the Landsat 7 ETM+, image
LE71490332009119SGS01 lost some scanning lines. In this study, we repaired
the lost scanning lines by using the gap-fill algorithm provided by the Geospatial
Data Cloud website (http://www.gscloud.cn/).
In addition to the agricultural land, the study area also contains other land-use/
land-cover types. Since the objective of this research is to test the effectiveness of
MODIS time series data with threshold model methods for extraction of PML over
agricultural land, a cropland mask was needed to mask out the non-agriculture land
in the study area.
17 Remote Sensing–Based Mapping of Plastic-Mulched Land Cover
367