

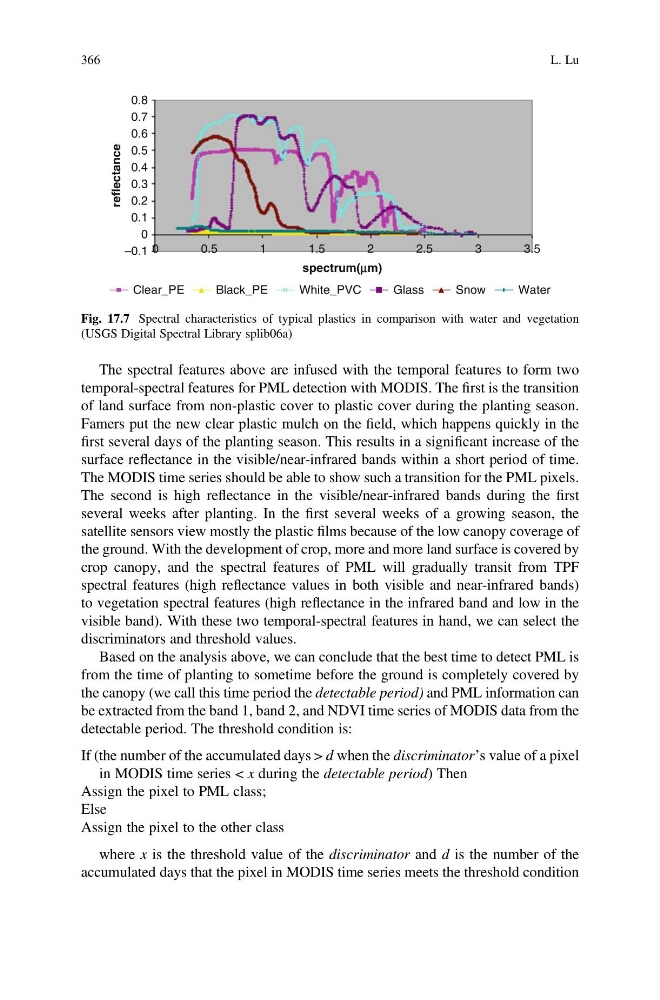
The spectral features above are infused with the temporal features to form two
temporal-spectral features for PML detection with MODIS. The first is the transition
of land surface from non-plastic cover to plastic cover during the planting season.
Famers put the new clear plastic mulch on the field, which happens quickly in the
first several days of the planting season. This results in a significant increase of the
surface reflectance in the visible/near-infrared bands within a short period of time.
The MODIS time series should be able to show such a transition for the PML pixels.
The second is high reflectance in the visible/near-infrared bands during the first
several weeks after planting. In the first several weeks of a growing season, the
satellite sensors view mostly the plastic films because of the low canopy coverage of
the ground. With the development of crop, more and more land surface is covered by
crop canopy, and the spectral features of PML will gradually transit from TPF
spectral features (high reflectance values in both visible and near-infrared bands)
to vegetation spectral features (high reflectance in the infrared band and low in the
visible band). With these two temporal-spectral features in hand, we can select the
discriminators and threshold values.
Based on the analysis above, we can conclude that the best time to detect PML is
from the time of planting to sometime before the ground is completely covered by
the canopy (we call this time period the detectable period) and PML information can
be extracted from the band 1, band 2, and NDVI time series of MODIS data from the
detectable period. The threshold condition is:
If (the number of the accumulated days > d when the discriminator’s value of a pixel
in MODIS time series < x during the detectable period) Then
Assign the pixel to PML class;
Else
Assign the pixel to the other class
where x is the threshold value of the discriminator and d is the number of the
accumulated days that the pixel in MODIS time series meets the threshold condition
–0.1
0
0
0.5
reflectance
1
1.5
spectrum(mm)
2
2.5
3
3.5
0.1
0.2
0.3
0.4
0.5
0.6
0.7
0.8
Clear_PE
Black_PE
White_PVC
Glass
Snow
Water
Fig. 17.7 Spectral characteristics of typical plastics in comparison with water and vegetation
(USGS Digital Spectral Library splib06a)
366
L. Lu
temporal-spectral features for PML detection with MODIS. The first is the transition
of land surface from non-plastic cover to plastic cover during the planting season.
Famers put the new clear plastic mulch on the field, which happens quickly in the
first several days of the planting season. This results in a significant increase of the
surface reflectance in the visible/near-infrared bands within a short period of time.
The MODIS time series should be able to show such a transition for the PML pixels.
The second is high reflectance in the visible/near-infrared bands during the first
several weeks after planting. In the first several weeks of a growing season, the
satellite sensors view mostly the plastic films because of the low canopy coverage of
the ground. With the development of crop, more and more land surface is covered by
crop canopy, and the spectral features of PML will gradually transit from TPF
spectral features (high reflectance values in both visible and near-infrared bands)
to vegetation spectral features (high reflectance in the infrared band and low in the
visible band). With these two temporal-spectral features in hand, we can select the
discriminators and threshold values.
Based on the analysis above, we can conclude that the best time to detect PML is
from the time of planting to sometime before the ground is completely covered by
the canopy (we call this time period the detectable period) and PML information can
be extracted from the band 1, band 2, and NDVI time series of MODIS data from the
detectable period. The threshold condition is:
If (the number of the accumulated days > d when the discriminator’s value of a pixel
in MODIS time series < x during the detectable period) Then
Assign the pixel to PML class;
Else
Assign the pixel to the other class
where x is the threshold value of the discriminator and d is the number of the
accumulated days that the pixel in MODIS time series meets the threshold condition
–0.1
0
0
0.5
reflectance
1
1.5
spectrum(mm)
2
2.5
3
3.5
0.1
0.2
0.3
0.4
0.5
0.6
0.7
0.8
Clear_PE
Black_PE
White_PVC
Glass
Snow
Water
Fig. 17.7 Spectral characteristics of typical plastics in comparison with water and vegetation
(USGS Digital Spectral Library splib06a)
366
L. Lu