

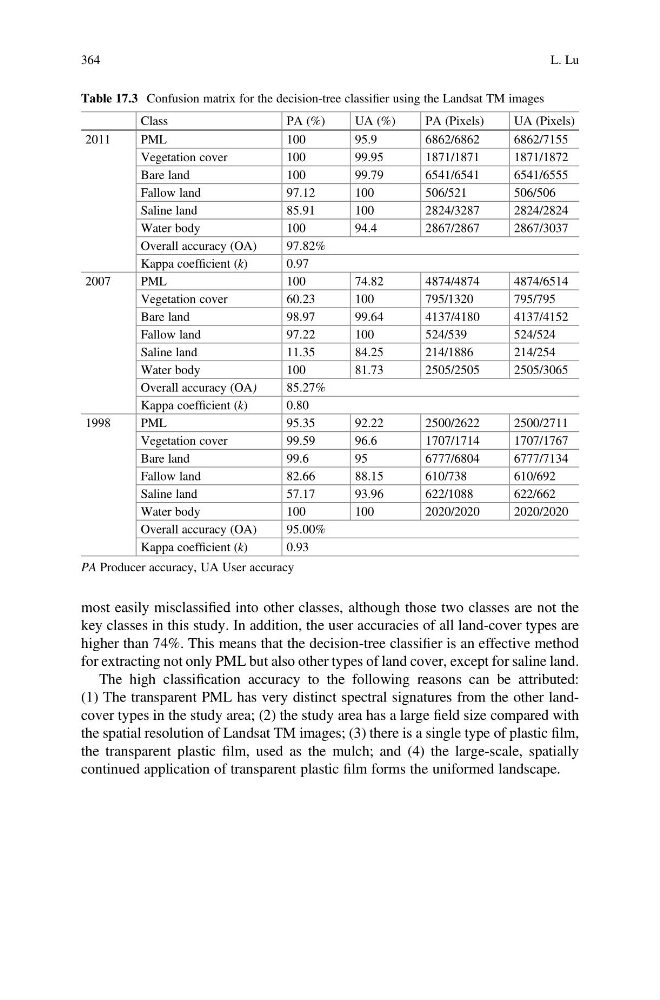
most easily misclassified into other classes, although those two classes are not the
key classes in this study. In addition, the user accuracies of all land-cover types are
higher than 74%. This means that the decision-tree classifier is an effective method
for extracting not only PML but also other types of land cover, except for saline land.
The high classification accuracy to the following reasons can be attributed:
(1) The transparent PML has very distinct spectral signatures from the other landcover types in the study area; (2) the study area has a large field size compared with
the spatial resolution of Landsat TM images; (3) there is a single type of plastic film,
the transparent plastic film, used as the mulch; and (4) the large-scale, spatially
continued application of transparent plastic film forms the uniformed landscape.
Table 17.3 Confusion matrix for the decision-tree classifier using the Landsat TM images
Class
PA (%)
UA (%)
PA (Pixels)
UA (Pixels)
2011
PML
100
95.9
6862/6862
6862/7155
Vegetation cover
100
99.95
1871/1871
1871/1872
Bare land
100
99.79
6541/6541
6541/6555
Fallow land
97.12
100
506/521
506/506
Saline land
85.91
100
2824/3287
2824/2824
Water body
100
94.4
2867/2867
2867/3037
Overall accuracy (OA)
97.82%
Kappa coefficient (k)
0.97
2007
PML
100
74.82
4874/4874
4874/6514
Vegetation cover
60.23
100
795/1320
795/795
Bare land
98.97
99.64
4137/4180
4137/4152
Fallow land
97.22
100
524/539
524/524
Saline land
11.35
84.25
214/1886
214/254
Water body
100
81.73
2505/2505
2505/3065
Overall accuracy (OA)
85.27%
Kappa coefficient (k)
0.80
1998
PML
95.35
92.22
2500/2622
2500/2711
Vegetation cover
99.59
96.6
1707/1714
1707/1767
Bare land
99.6
95
6777/6804
6777/7134
Fallow land
82.66
88.15
610/738
610/692
Saline land
57.17
93.96
622/1088
622/662
Water body
100
100
2020/2020
2020/2020
Overall accuracy (OA)
95.00%
Kappa coefficient (k)
0.93
PA Producer accuracy, UA User accuracy
364
L. Lu
key classes in this study. In addition, the user accuracies of all land-cover types are
higher than 74%. This means that the decision-tree classifier is an effective method
for extracting not only PML but also other types of land cover, except for saline land.
The high classification accuracy to the following reasons can be attributed:
(1) The transparent PML has very distinct spectral signatures from the other landcover types in the study area; (2) the study area has a large field size compared with
the spatial resolution of Landsat TM images; (3) there is a single type of plastic film,
the transparent plastic film, used as the mulch; and (4) the large-scale, spatially
continued application of transparent plastic film forms the uniformed landscape.
Table 17.3 Confusion matrix for the decision-tree classifier using the Landsat TM images
Class
PA (%)
UA (%)
PA (Pixels)
UA (Pixels)
2011
PML
100
95.9
6862/6862
6862/7155
Vegetation cover
100
99.95
1871/1871
1871/1872
Bare land
100
99.79
6541/6541
6541/6555
Fallow land
97.12
100
506/521
506/506
Saline land
85.91
100
2824/3287
2824/2824
Water body
100
94.4
2867/2867
2867/3037
Overall accuracy (OA)
97.82%
Kappa coefficient (k)
0.97
2007
PML
100
74.82
4874/4874
4874/6514
Vegetation cover
60.23
100
795/1320
795/795
Bare land
98.97
99.64
4137/4180
4137/4152
Fallow land
97.22
100
524/539
524/524
Saline land
11.35
84.25
214/1886
214/254
Water body
100
81.73
2505/2505
2505/3065
Overall accuracy (OA)
85.27%
Kappa coefficient (k)
0.80
1998
PML
95.35
92.22
2500/2622
2500/2711
Vegetation cover
99.59
96.6
1707/1714
1707/1767
Bare land
99.6
95
6777/6804
6777/7134
Fallow land
82.66
88.15
610/738
610/692
Saline land
57.17
93.96
622/1088
622/662
Water body
100
100
2020/2020
2020/2020
Overall accuracy (OA)
95.00%
Kappa coefficient (k)
0.93
PA Producer accuracy, UA User accuracy
364
L. Lu