

In addition to having technologies and systems to monitor flooding events in a
more efficient manner, it is also paramount to use similar geospatial techniques to
further quantify the impact of these natural disasters in terms of assessing the crop
damages. Using remote sensing data, a classification-based method to monitor the
crop loss assessment due to the oversupply of water could be an effective process to
carry out, especially in more localized regions. The simplicity of this method which
compares before and after disaster land cover classified images to quantify the crop
damages makes it extremely attractive. That said, unavailability of historical data,
higher cost, and lack of large spatial extent (if using airborne images) as well as
coarse spatial resolution and high vulnerability to noise contamination (if using
satellite images) could be limiting factors for the classification-based flood crop
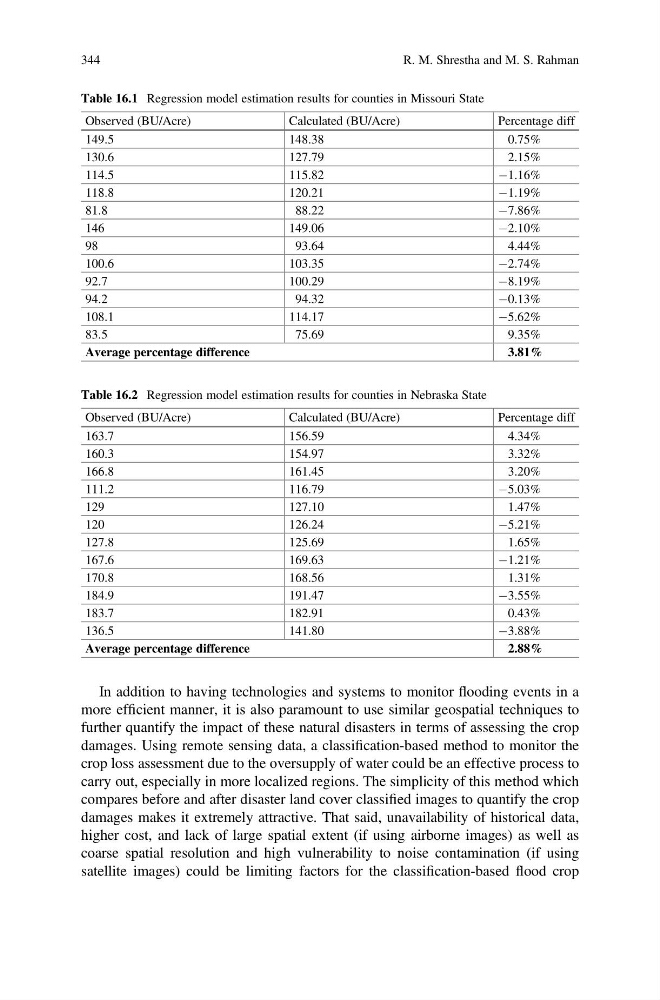
Table 16.1 Regression model estimation results for counties in Missouri State
Observed (BU/Acre)
Calculated (BU/Acre)
Percentage diff
149.5
148.38
0.75%
130.6
127.79
2.15%
114.5
115.82
À1.16%
118.8
120.21
À1.19%
81.8
88.22
À7.86%
146
149.06
À2.10%
98
93.64
4.44%
100.6
103.35
À2.74%
92.7
100.29
À8.19%
94.2
94.32
À0.13%
108.1
114.17
À5.62%
83.5
75.69
9.35%
Average percentage difference
3.81%
Table 16.2 Regression model estimation results for counties in Nebraska State
Observed (BU/Acre)
Calculated (BU/Acre)
Percentage diff
163.7
156.59
4.34%
160.3
154.97
3.32%
166.8
161.45
3.20%
111.2
116.79
À5.03%
129
127.10
1.47%
120
126.24
À5.21%
127.8
125.69
1.65%
167.6
169.63
À1.21%
170.8
168.56
1.31%
184.9
191.47
À3.55%
183.7
182.91
0.43%
136.5
141.80
À3.88%
Average percentage difference
2.88%
344
R. M. Shrestha and M. S. Rahman
more efficient manner, it is also paramount to use similar geospatial techniques to
further quantify the impact of these natural disasters in terms of assessing the crop
damages. Using remote sensing data, a classification-based method to monitor the
crop loss assessment due to the oversupply of water could be an effective process to
carry out, especially in more localized regions. The simplicity of this method which
compares before and after disaster land cover classified images to quantify the crop
damages makes it extremely attractive. That said, unavailability of historical data,
higher cost, and lack of large spatial extent (if using airborne images) as well as
coarse spatial resolution and high vulnerability to noise contamination (if using
satellite images) could be limiting factors for the classification-based flood crop
Table 16.1 Regression model estimation results for counties in Missouri State
Observed (BU/Acre)
Calculated (BU/Acre)
Percentage diff
149.5
148.38
0.75%
130.6
127.79
2.15%
114.5
115.82
À1.16%
118.8
120.21
À1.19%
81.8
88.22
À7.86%
146
149.06
À2.10%
98
93.64
4.44%
100.6
103.35
À2.74%
92.7
100.29
À8.19%
94.2
94.32
À0.13%
108.1
114.17
À5.62%
83.5
75.69
9.35%
Average percentage difference
3.81%
Table 16.2 Regression model estimation results for counties in Nebraska State
Observed (BU/Acre)
Calculated (BU/Acre)
Percentage diff
163.7
156.59
4.34%
160.3
154.97
3.32%
166.8
161.45
3.20%
111.2
116.79
À5.03%
129
127.10
1.47%
120
126.24
À5.21%
127.8
125.69
1.65%
167.6
169.63
À1.21%
170.8
168.56
1.31%
184.9
191.47
À3.55%
183.7
182.91
0.43%
136.5
141.80
À3.88%
Average percentage difference
2.88%
344
R. M. Shrestha and M. S. Rahman