

16.4.5.2 Model Estimation
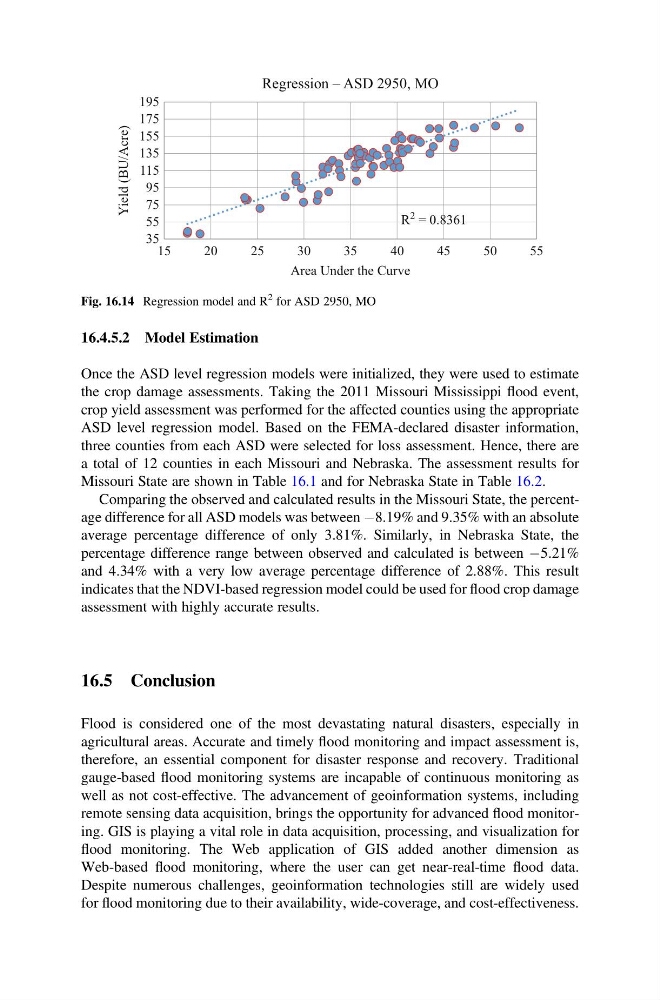
Once the ASD level regression models were initialized, they were used to estimate
the crop damage assessments. Taking the 2011 Missouri Mississippi flood event,
crop yield assessment was performed for the affected counties using the appropriate
ASD level regression model. Based on the FEMA-declared disaster information,
three counties from each ASD were selected for loss assessment. Hence, there are
a total of 12 counties in each Missouri and Nebraska. The assessment results for
Missouri State are shown in Table 16.1 and for Nebraska State in Table 16.2.
Comparing the observed and calculated results in the Missouri State, the percentage difference for all ASD models was between À8.19% and 9.35% with an absolute
average percentage difference of only 3.81%. Similarly, in Nebraska State, the
percentage difference range between observed and calculated is between À5.21%
and 4.34% with a very low average percentage difference of 2.88%. This result
indicates that the NDVI-based regression model could be used for flood crop damage
assessment with highly accurate results.
16.5 Conclusion
Flood is considered one of the most devastating natural disasters, especially in
agricultural areas. Accurate and timely flood monitoring and impact assessment is,
therefore, an essential component for disaster response and recovery. Traditional
gauge-based flood monitoring systems are incapable of continuous monitoring as
well as not cost-effective. The advancement of geoinformation systems, including
remote sensing data acquisition, brings the opportunity for advanced flood monitoring. GIS is playing a vital role in data acquisition, processing, and visualization for
flood monitoring. The Web application of GIS added another dimension as
Web-based flood monitoring, where the user can get near-real-time flood data.
Despite numerous challenges, geoinformation technologies still are widely used
for flood monitoring due to their availability, wide-coverage, and cost-effectiveness.
R
2 = 0.8361
35
55
75
95
115
135
155
175
195
15
20
25
30
35
40
45
50
55
Yield (BU/Acre)
Area Under the Curve
Regression – ASD 2950, MO
Fig. 16.14 Regression model and R
2 for ASD 2950, MO
Once the ASD level regression models were initialized, they were used to estimate
the crop damage assessments. Taking the 2011 Missouri Mississippi flood event,
crop yield assessment was performed for the affected counties using the appropriate
ASD level regression model. Based on the FEMA-declared disaster information,
three counties from each ASD were selected for loss assessment. Hence, there are
a total of 12 counties in each Missouri and Nebraska. The assessment results for
Missouri State are shown in Table 16.1 and for Nebraska State in Table 16.2.
Comparing the observed and calculated results in the Missouri State, the percentage difference for all ASD models was between À8.19% and 9.35% with an absolute
average percentage difference of only 3.81%. Similarly, in Nebraska State, the
percentage difference range between observed and calculated is between À5.21%
and 4.34% with a very low average percentage difference of 2.88%. This result
indicates that the NDVI-based regression model could be used for flood crop damage
assessment with highly accurate results.
16.5 Conclusion
Flood is considered one of the most devastating natural disasters, especially in
agricultural areas. Accurate and timely flood monitoring and impact assessment is,
therefore, an essential component for disaster response and recovery. Traditional
gauge-based flood monitoring systems are incapable of continuous monitoring as
well as not cost-effective. The advancement of geoinformation systems, including
remote sensing data acquisition, brings the opportunity for advanced flood monitoring. GIS is playing a vital role in data acquisition, processing, and visualization for
flood monitoring. The Web application of GIS added another dimension as
Web-based flood monitoring, where the user can get near-real-time flood data.
Despite numerous challenges, geoinformation technologies still are widely used
for flood monitoring due to their availability, wide-coverage, and cost-effectiveness.
R
2 = 0.8361
35
55
75
95
115
135
155
175
195
15
20
25
30
35
40
45
50
55
Yield (BU/Acre)
Area Under the Curve
Regression – ASD 2950, MO
Fig. 16.14 Regression model and R
2 for ASD 2950, MO