

ratio as a dependent variable. To capture the homogeneity in terms of agricultural
properties of counties, a regression model for each ASD was derived separately.
Each ASD level regression model was initialized by using normal NDVI and corn
yield between the years 2000 and 2015 from counties within that ASD. Hence, in
this case study, four ASD (2910, 2930, 2950, and 2960) in Missouri State and four
ASD (3160, 3170, 3180, and 3190) in Nebraska State will each have separate
regression models. For each ASD, the total number of counties ranged between
10 and 15, and as the model used past 16 years of data, the total observations for each
ASD level regression model ranged from 160 to 240.
16.4.5 Result
16.4.5.1 Regression Result
The regression result for all eight ASD showed a statistically significant relationship
between the independent variable AUC and the dependent variable corn yield ratio.
The coefficient of deterministic (R
2 ) for all four ASD in the Nebraska State was
above 0.86. ASD 3180 had the highest R
2 (0.92), and ASD 3160 had the lowest R
2
with 0.86. Both ASD 3170 and 3190 had R
2 of 0.90. Similarly, the R
2 for three out of
four ASD level regressions in the Missouri State was above 0.82 with the highest R
2
of 0.87 in the regression of ASD 2930. Only the regression model for ASD 2910 had
R
2 below 0.82 (0.78). This indicates that for all ASD level regression models in this
case study, the independent variables are able to explain the dependent variable at
least 82% of the time, except for the regression model for ASD 2910 which is at
78%. Figures 16.11, 16.12, 16.13 and 16.14 show the regression model relationship
and their coefficient of deterministic for ASD 3160, 3180, 2930, and 2950.
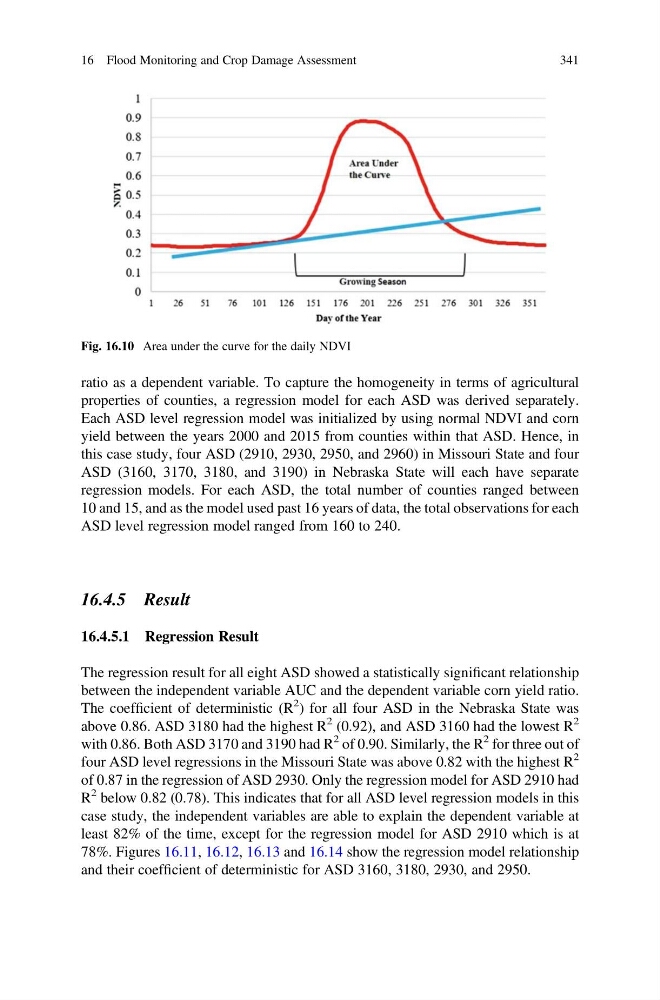
Fig. 16.10 Area under the curve for the daily NDVI
16 Flood Monitoring and Crop Damage Assessment
341
properties of counties, a regression model for each ASD was derived separately.
Each ASD level regression model was initialized by using normal NDVI and corn
yield between the years 2000 and 2015 from counties within that ASD. Hence, in
this case study, four ASD (2910, 2930, 2950, and 2960) in Missouri State and four
ASD (3160, 3170, 3180, and 3190) in Nebraska State will each have separate
regression models. For each ASD, the total number of counties ranged between
10 and 15, and as the model used past 16 years of data, the total observations for each
ASD level regression model ranged from 160 to 240.
16.4.5 Result
16.4.5.1 Regression Result
The regression result for all eight ASD showed a statistically significant relationship
between the independent variable AUC and the dependent variable corn yield ratio.
The coefficient of deterministic (R
2 ) for all four ASD in the Nebraska State was
above 0.86. ASD 3180 had the highest R
2 (0.92), and ASD 3160 had the lowest R
2
with 0.86. Both ASD 3170 and 3190 had R
2 of 0.90. Similarly, the R
2 for three out of
four ASD level regressions in the Missouri State was above 0.82 with the highest R
2
of 0.87 in the regression of ASD 2930. Only the regression model for ASD 2910 had
R
2 below 0.82 (0.78). This indicates that for all ASD level regression models in this
case study, the independent variables are able to explain the dependent variable at
least 82% of the time, except for the regression model for ASD 2910 which is at
78%. Figures 16.11, 16.12, 16.13 and 16.14 show the regression model relationship
and their coefficient of deterministic for ASD 3160, 3180, 2930, and 2950.
Fig. 16.10 Area under the curve for the daily NDVI
16 Flood Monitoring and Crop Damage Assessment
341